more normal than most
I was always a bit confused by one of the lyrics of Tricky’s Struglin’ - “I think I’m more normal than most”.
I’ve just finished the very short introduction to statistics, and now I get it!
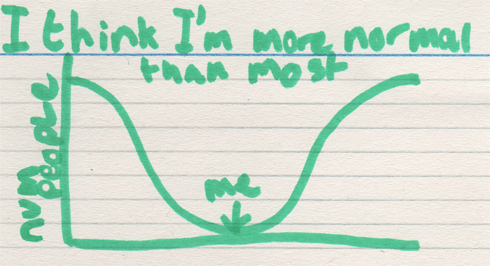
So the X axis is something, like cleanliness or laziness, and the Y axis is how many people are that clean or lazy.
If the distribution looks like this, then if you are in the middle, then you are more normal than most!
