A Plane of Thrones
Ishaan wrote a paper, I helped by putting some puns in. Through the strange machinations of the universe, I presented it at ACADIA this week.
The slides are here as a slideshow, and below as a more unrolled version with notes:
-
-
These are the slides I used at ACADIA, and as a special treat, the speaker notes.
-
-
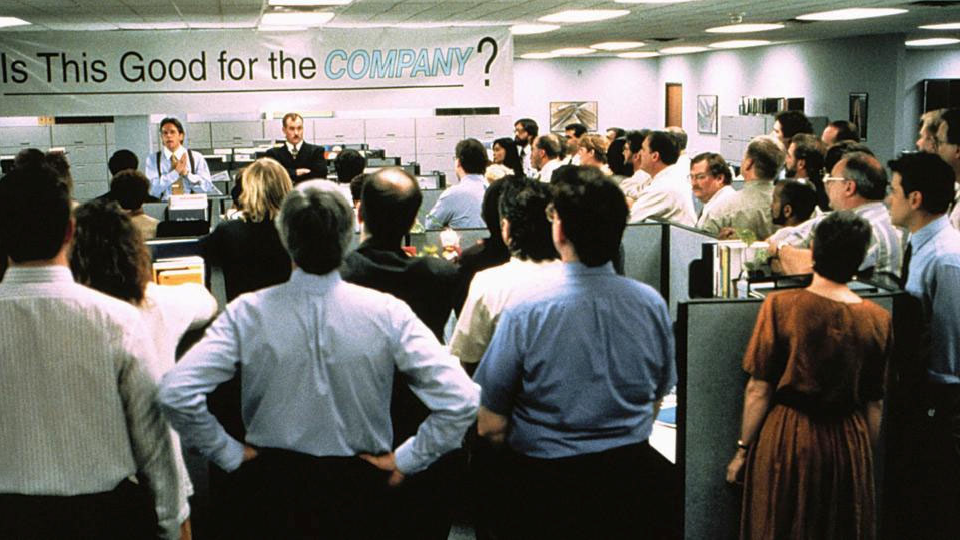
Where do we sit at work?
Can that have an effect on our effectiveness? Happiness?
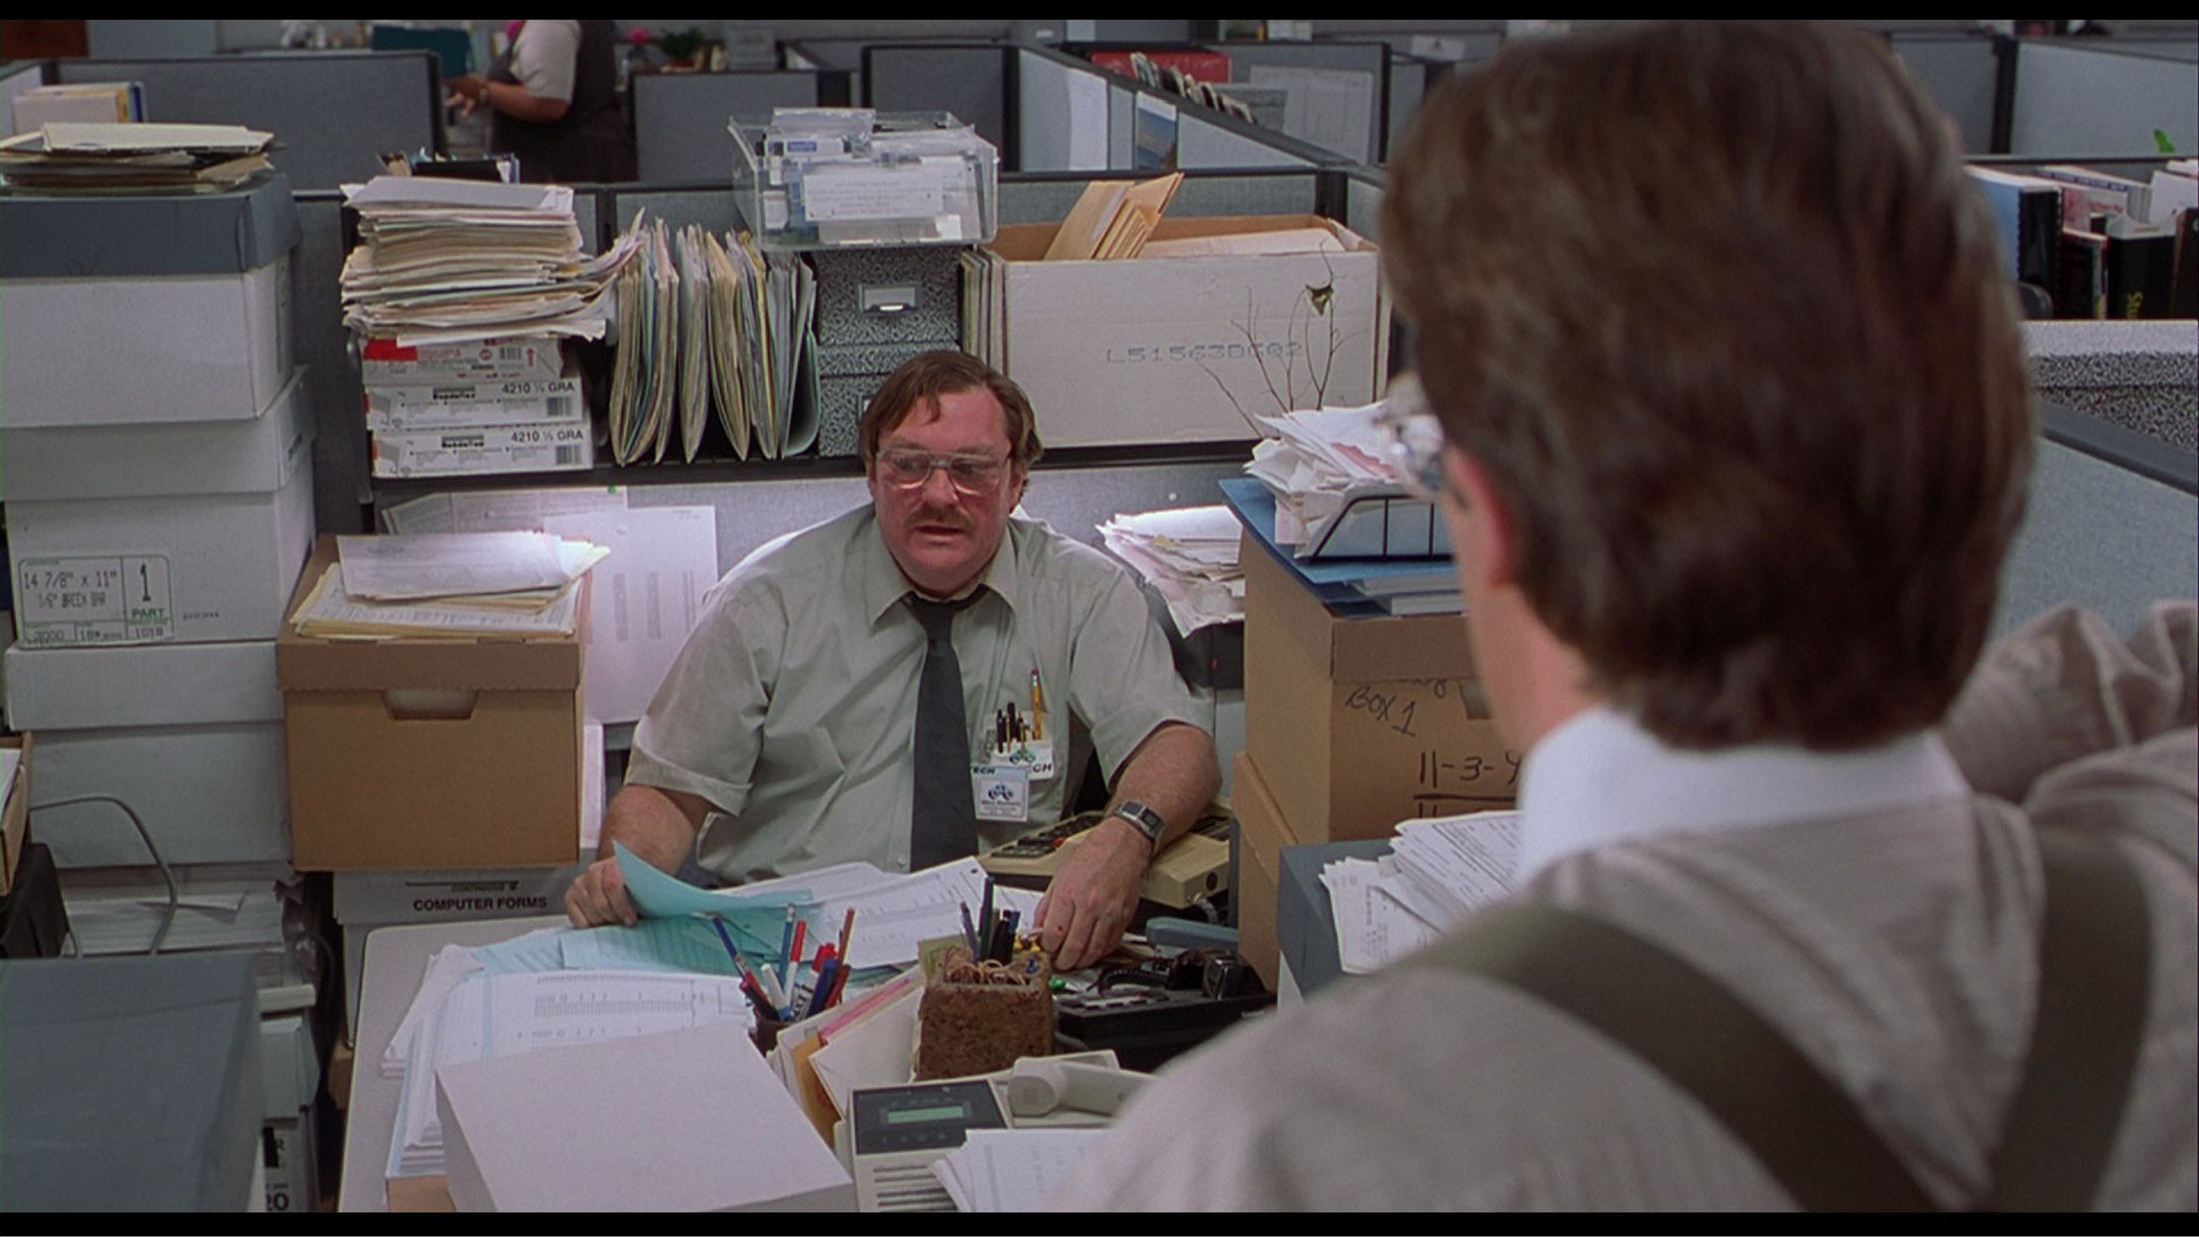
(Some of this is going to make more sense if you’ve seen Office Space five or six times)
-
-
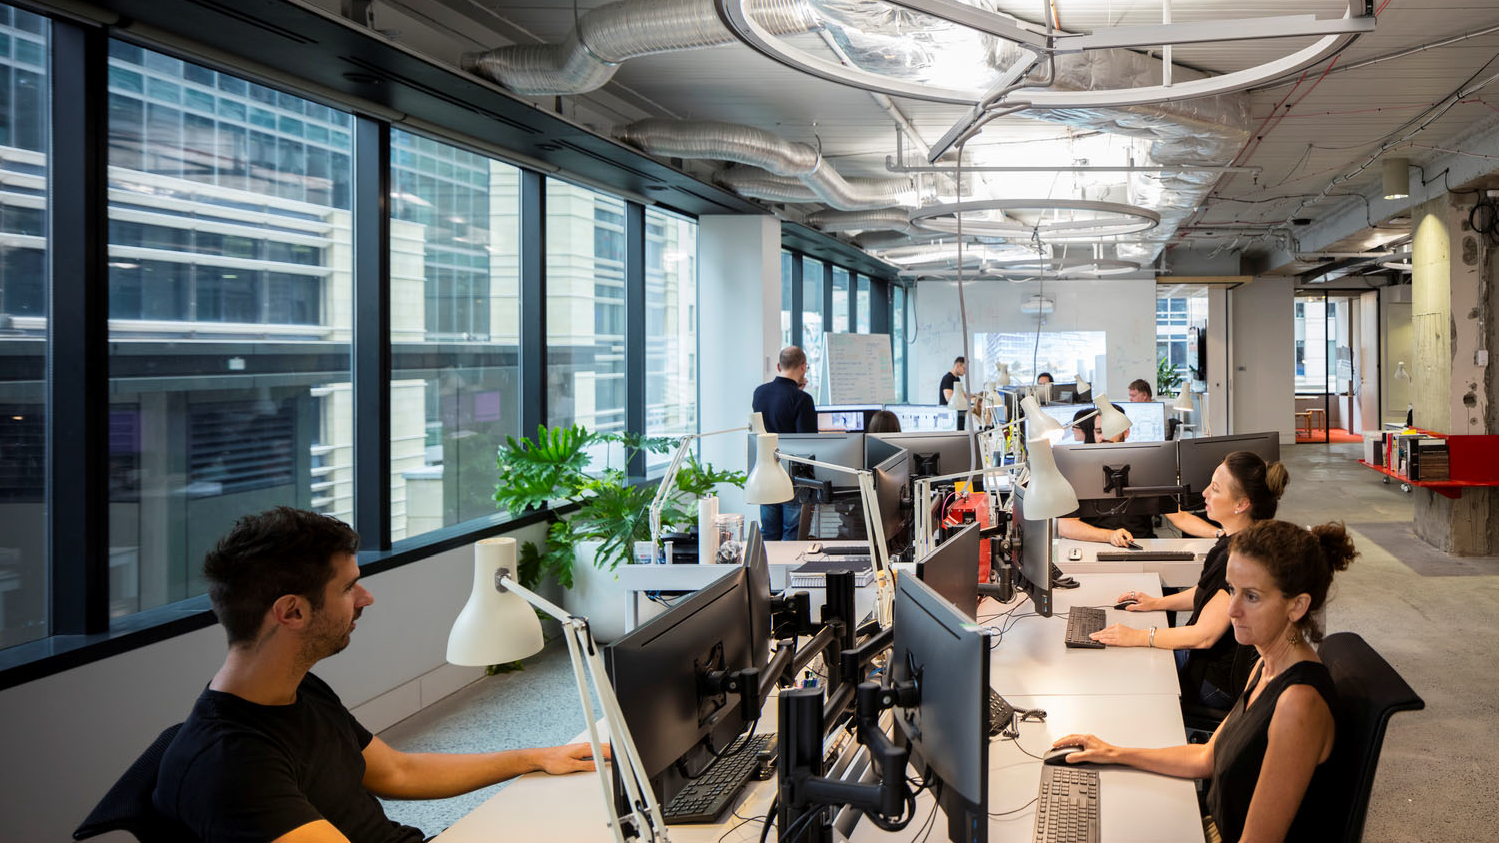
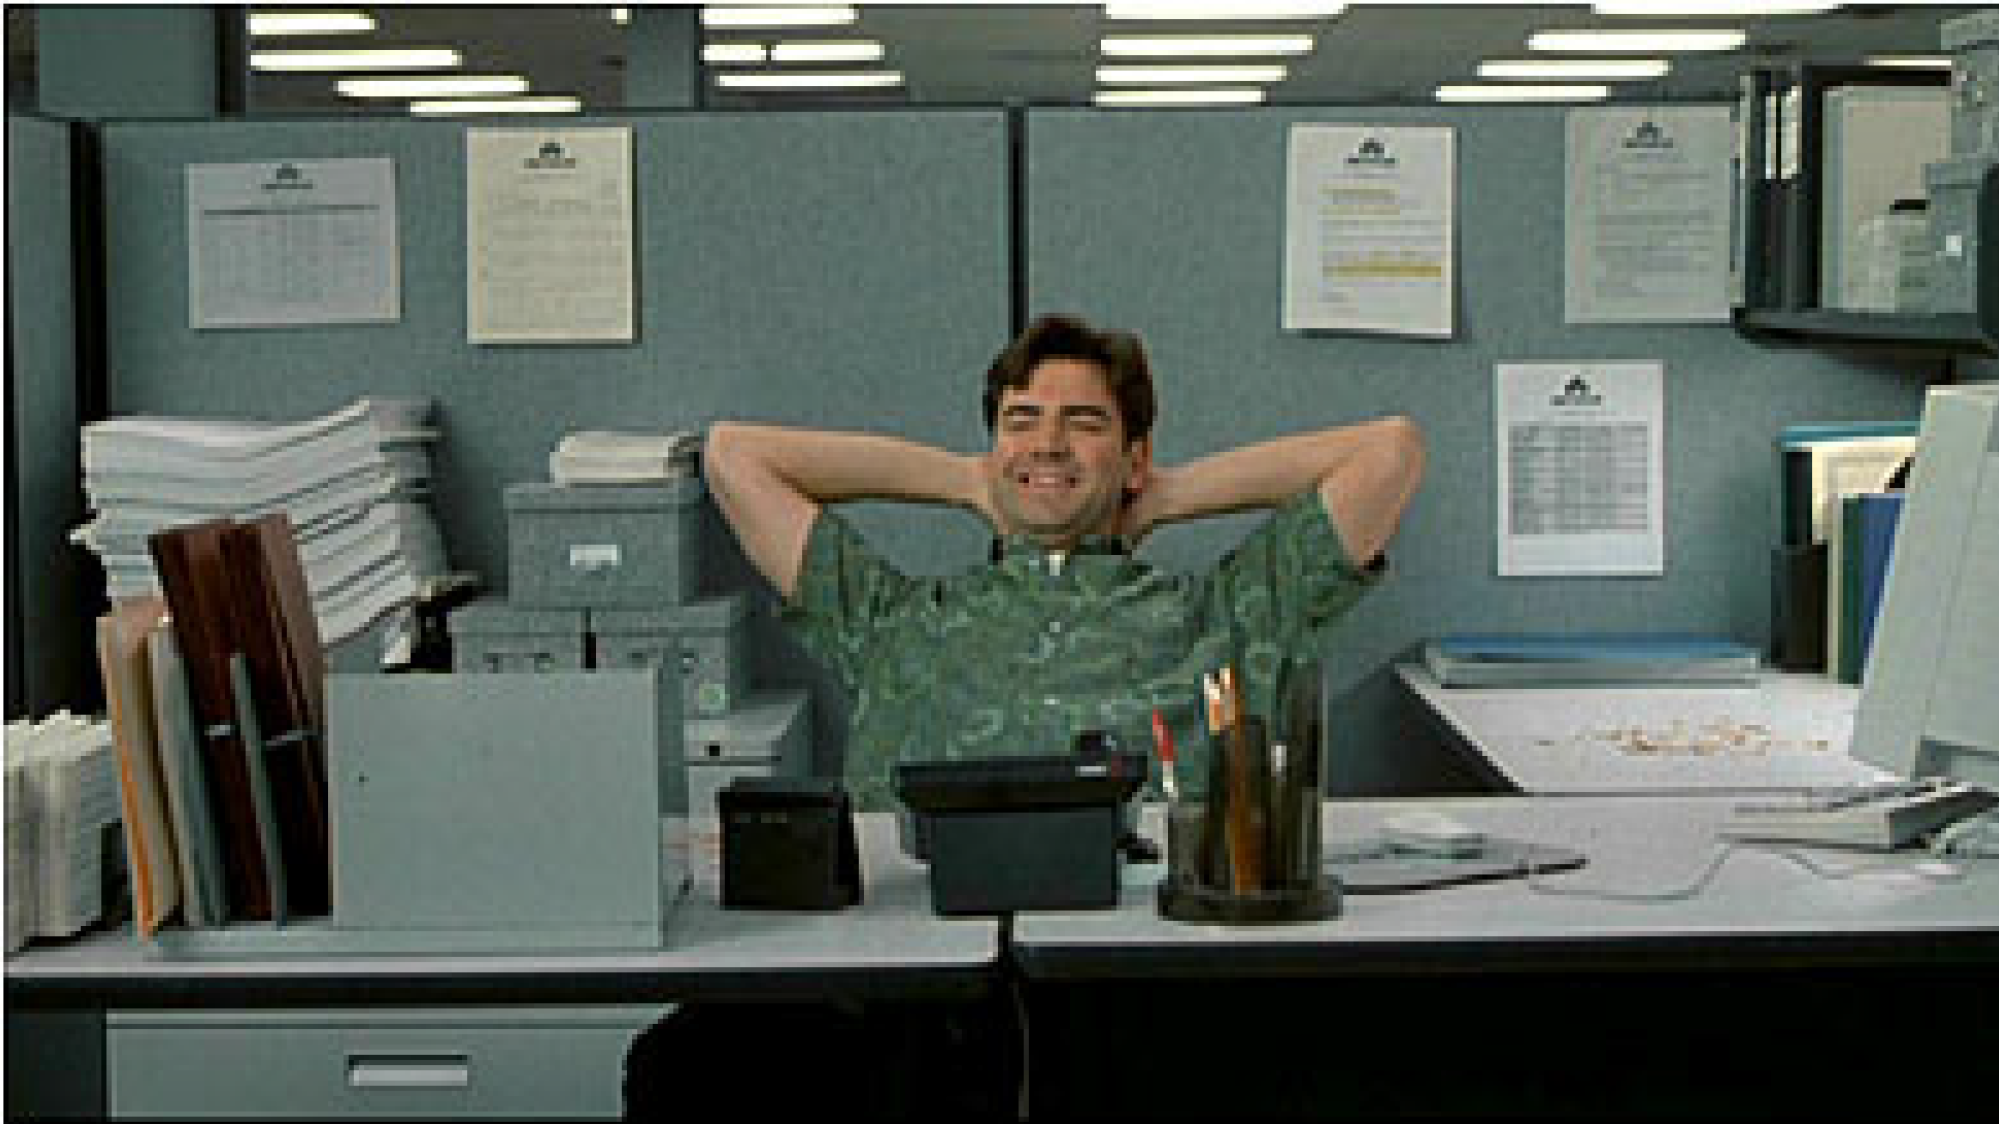
Technology has more or less solved all the problems that stopped people working from home/wherever they want, so why do we even come to work?
-
-
other people!
Some of the benefit of being in the same space, in the office, is going to meetings. Some of it is “team work”.
-
-
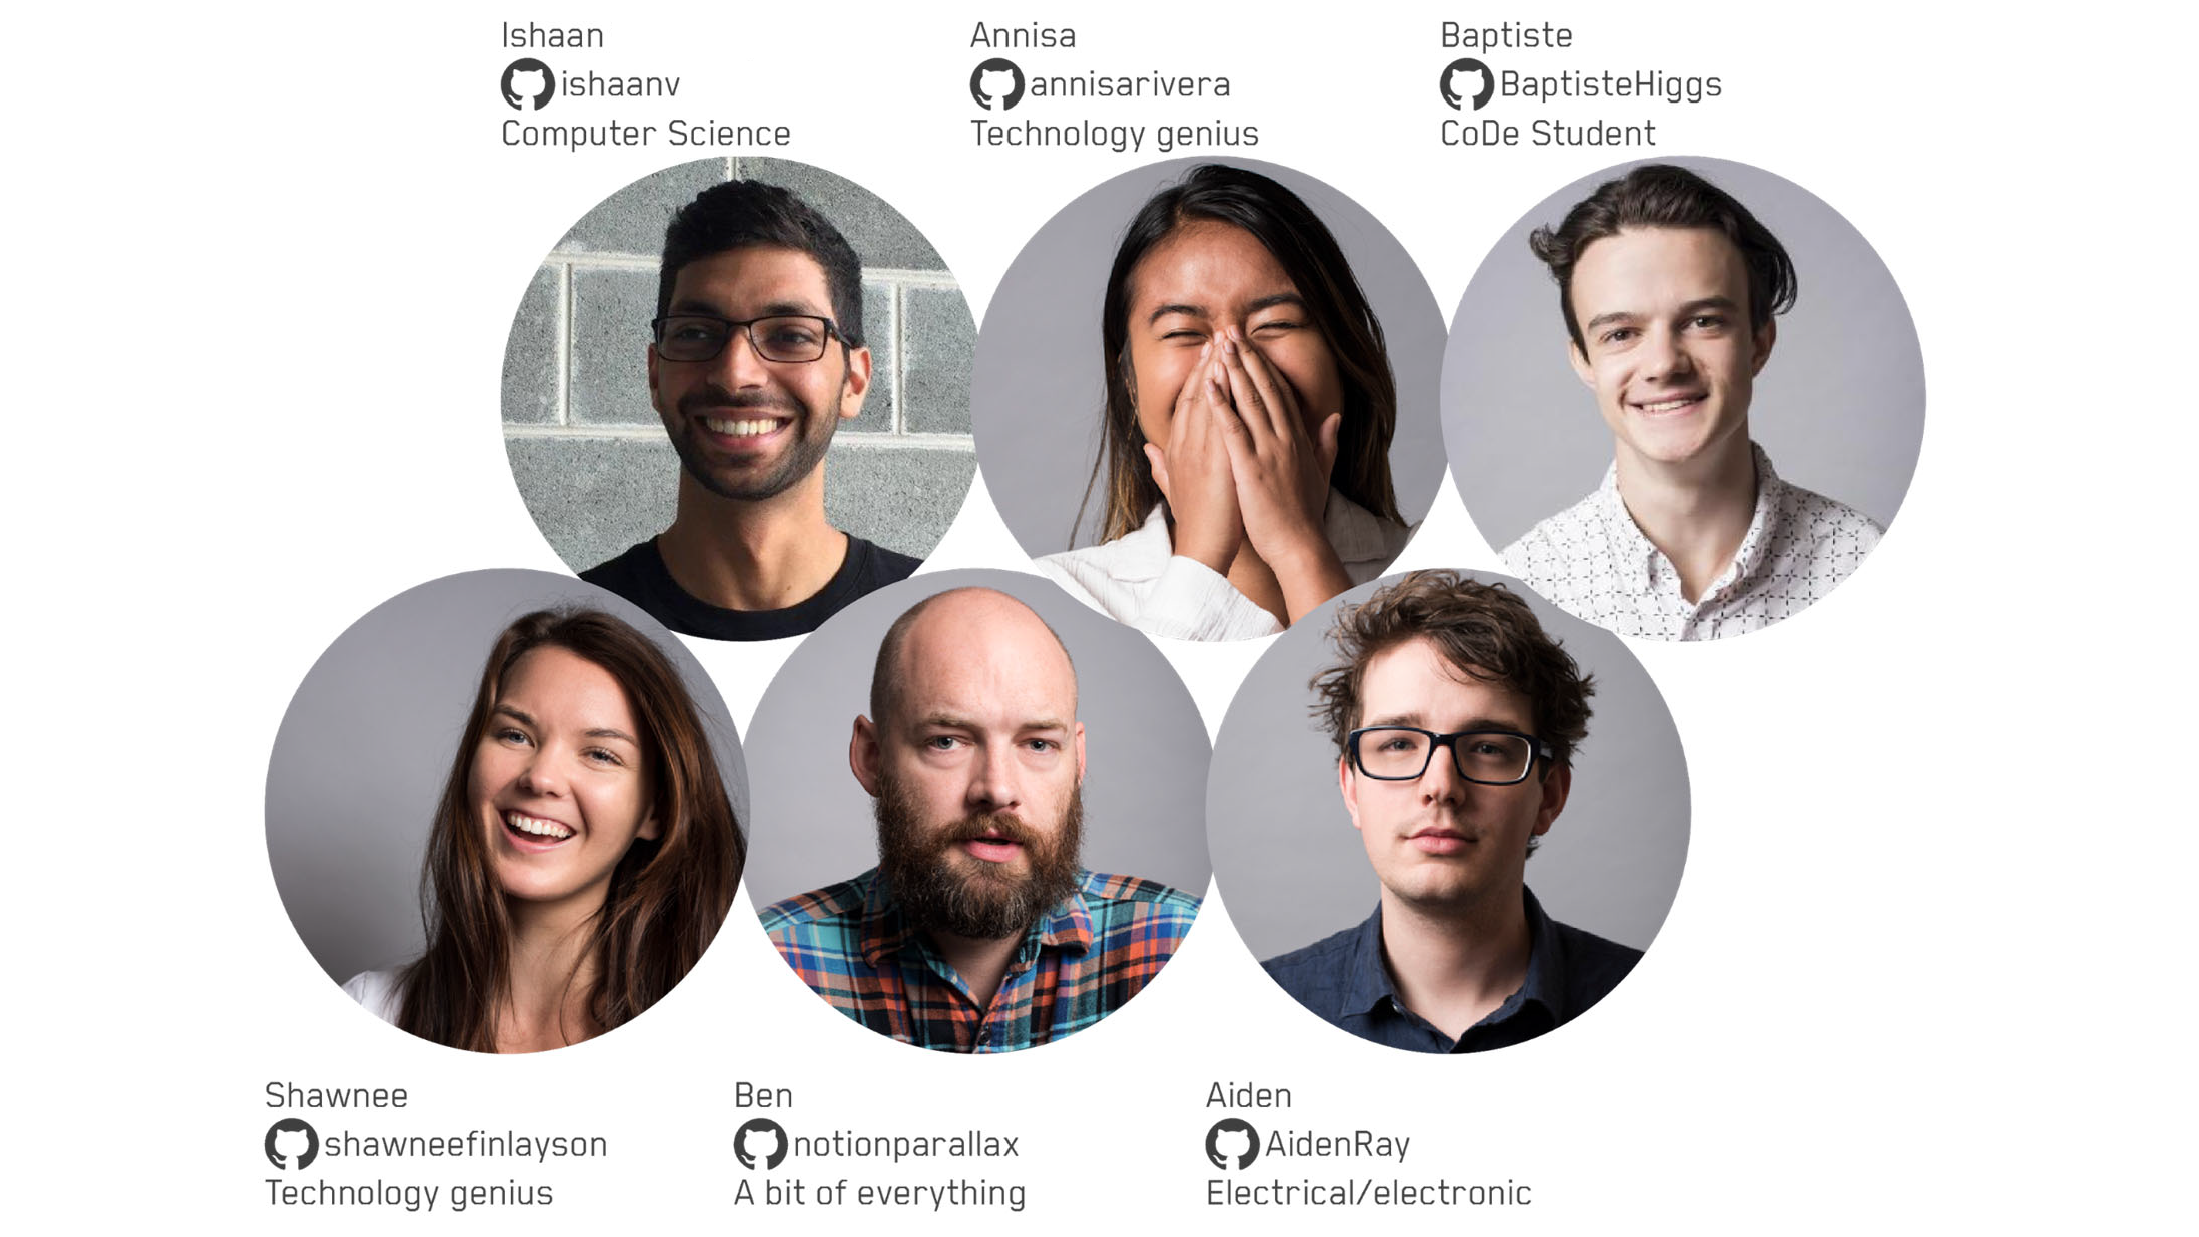
Speaking of, although Ishaan and I are listed as the authors of this paper, there was a fair bit of support from the rest of our team.
The lion’s share of the real work (the maths and ML) on this paper was done by Ishaan,
Shawnee and Annisa did a lot of work on exporting Revit data to JSON representations so that they can be re-presented on the web
Aiden and Baptiste did a lot of proofreading! Bep is going to need a new title as he’s graduating in a month, and as much as I’d like to keep him forever, if anyone wants to hire him, I’m sure we can work out a transfer deal.
I mostly did the puns
-
-
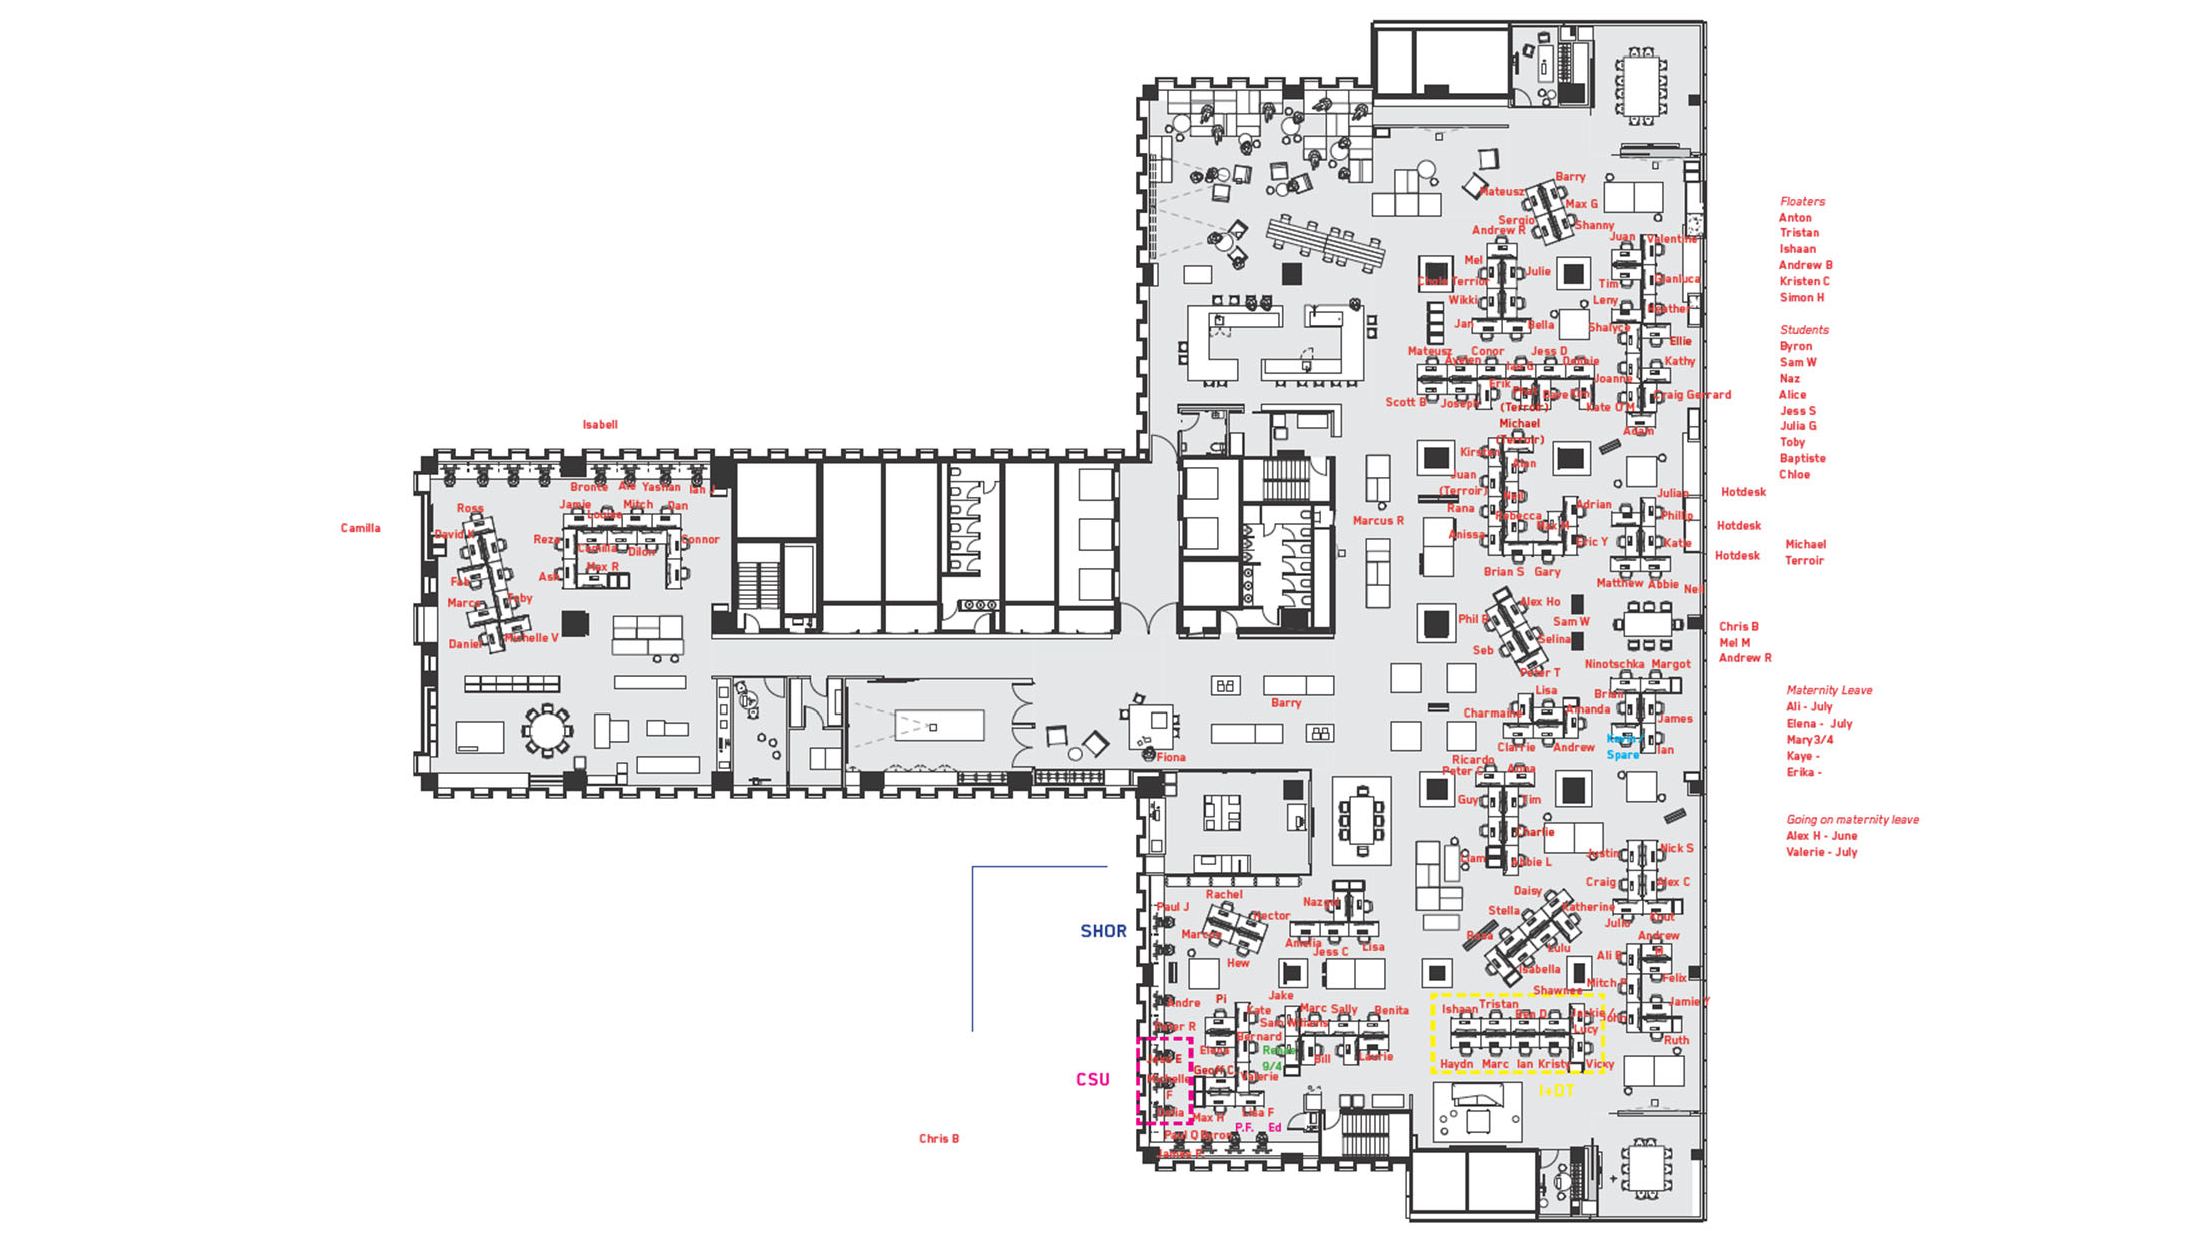
At BVN (where we work) teams are people who are assigned to the same project. (One person can be in many teams)
-
-
We traditionally have planned seating to correspond to that. Actually doing that planning takes a long time. It’s also not a law of nature that it’s the optimal way of doing it.
How could we solve the optimisation problem of fitting teams into a given seating plan, but in a suitably general way that we could explore other ideas about how to arrange people?
-
-
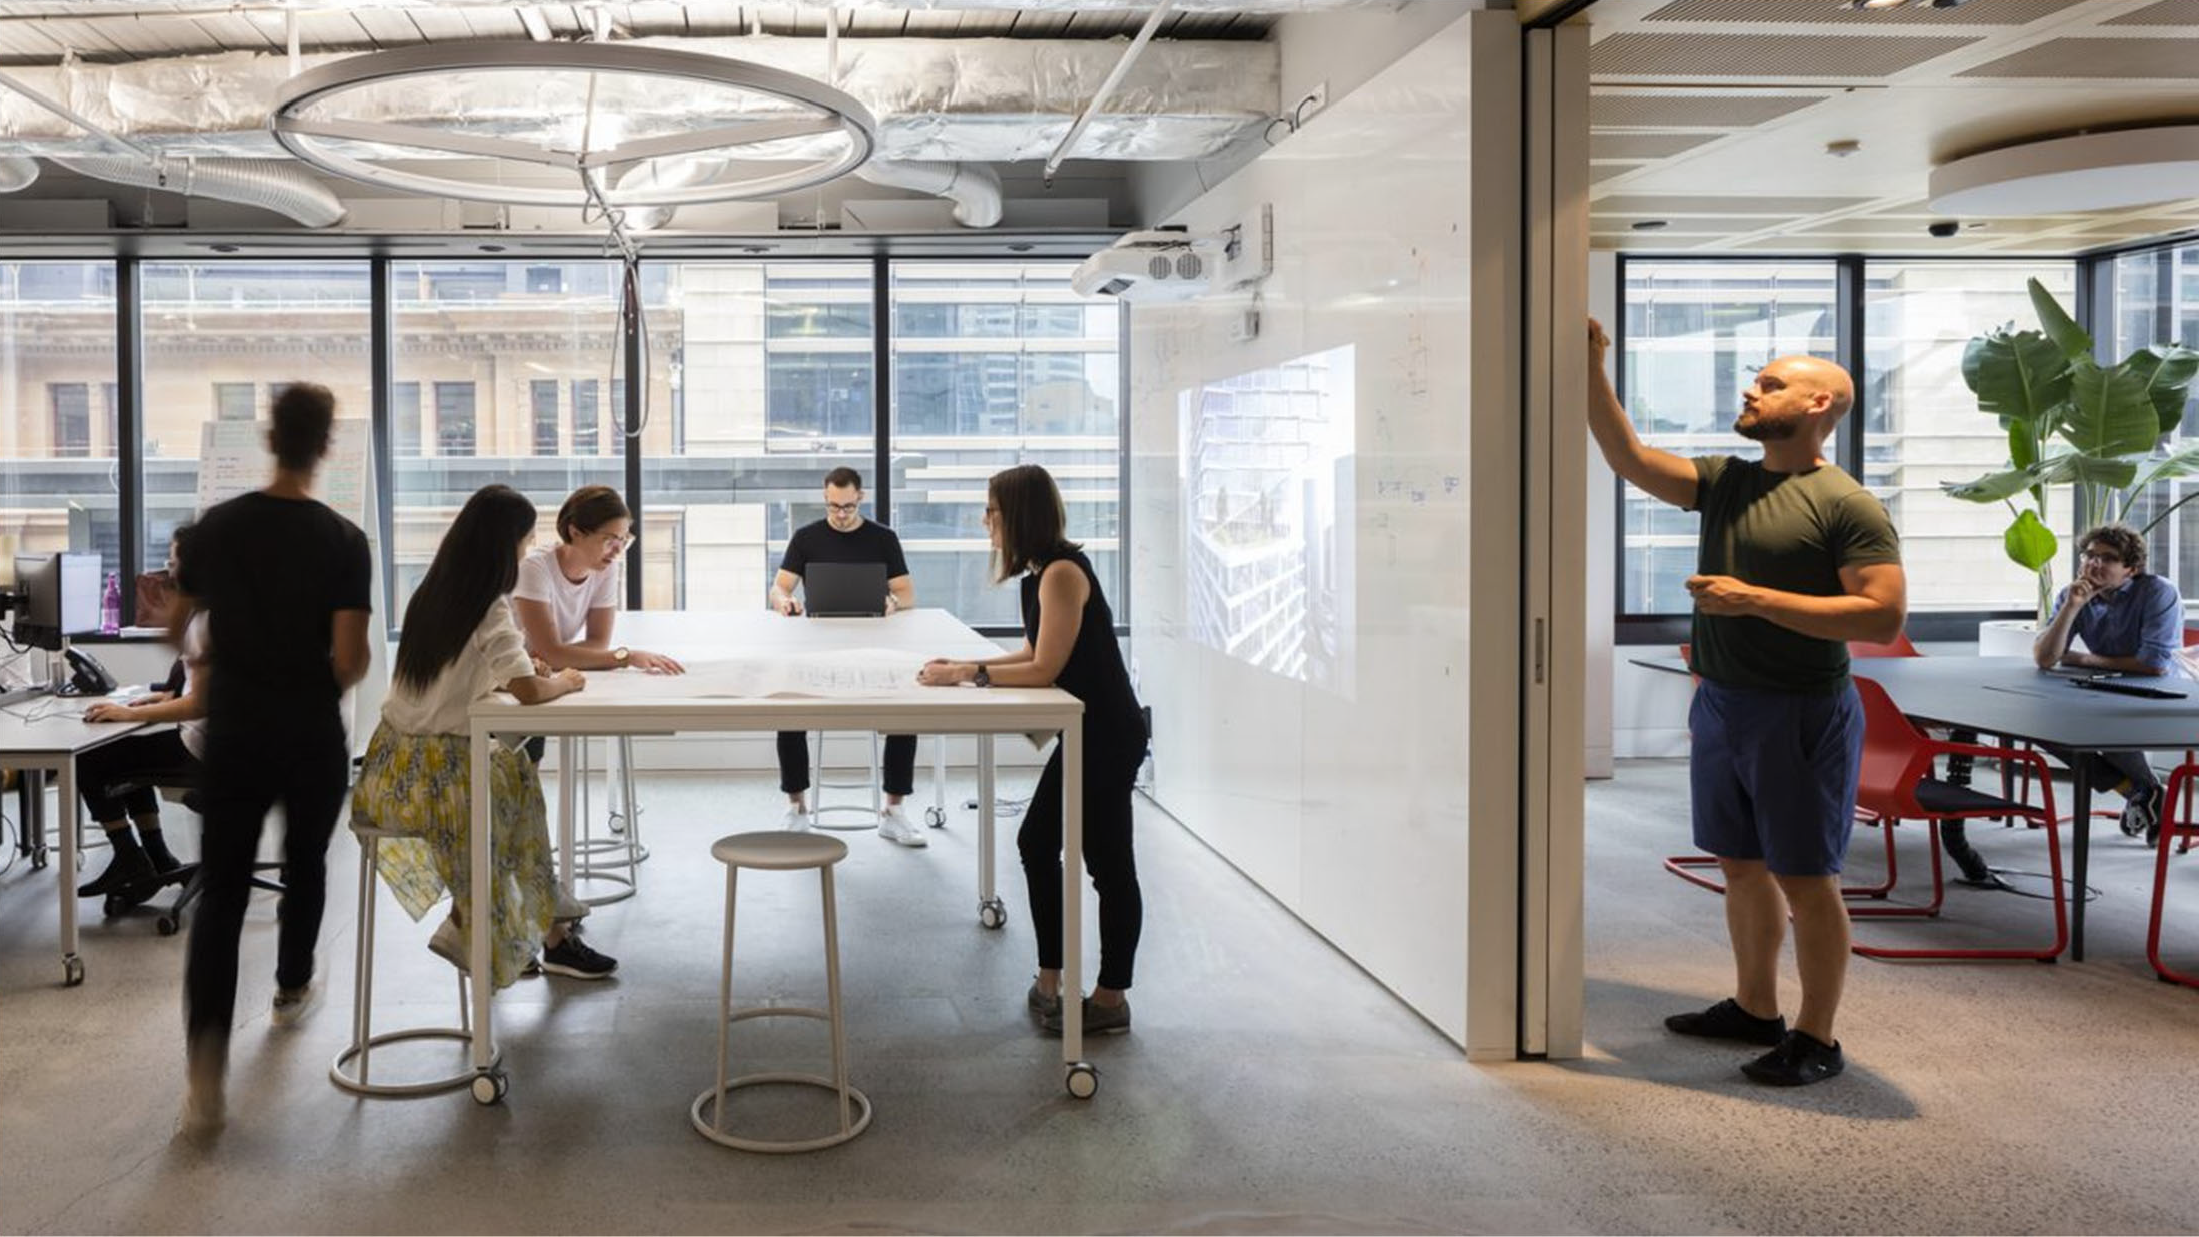
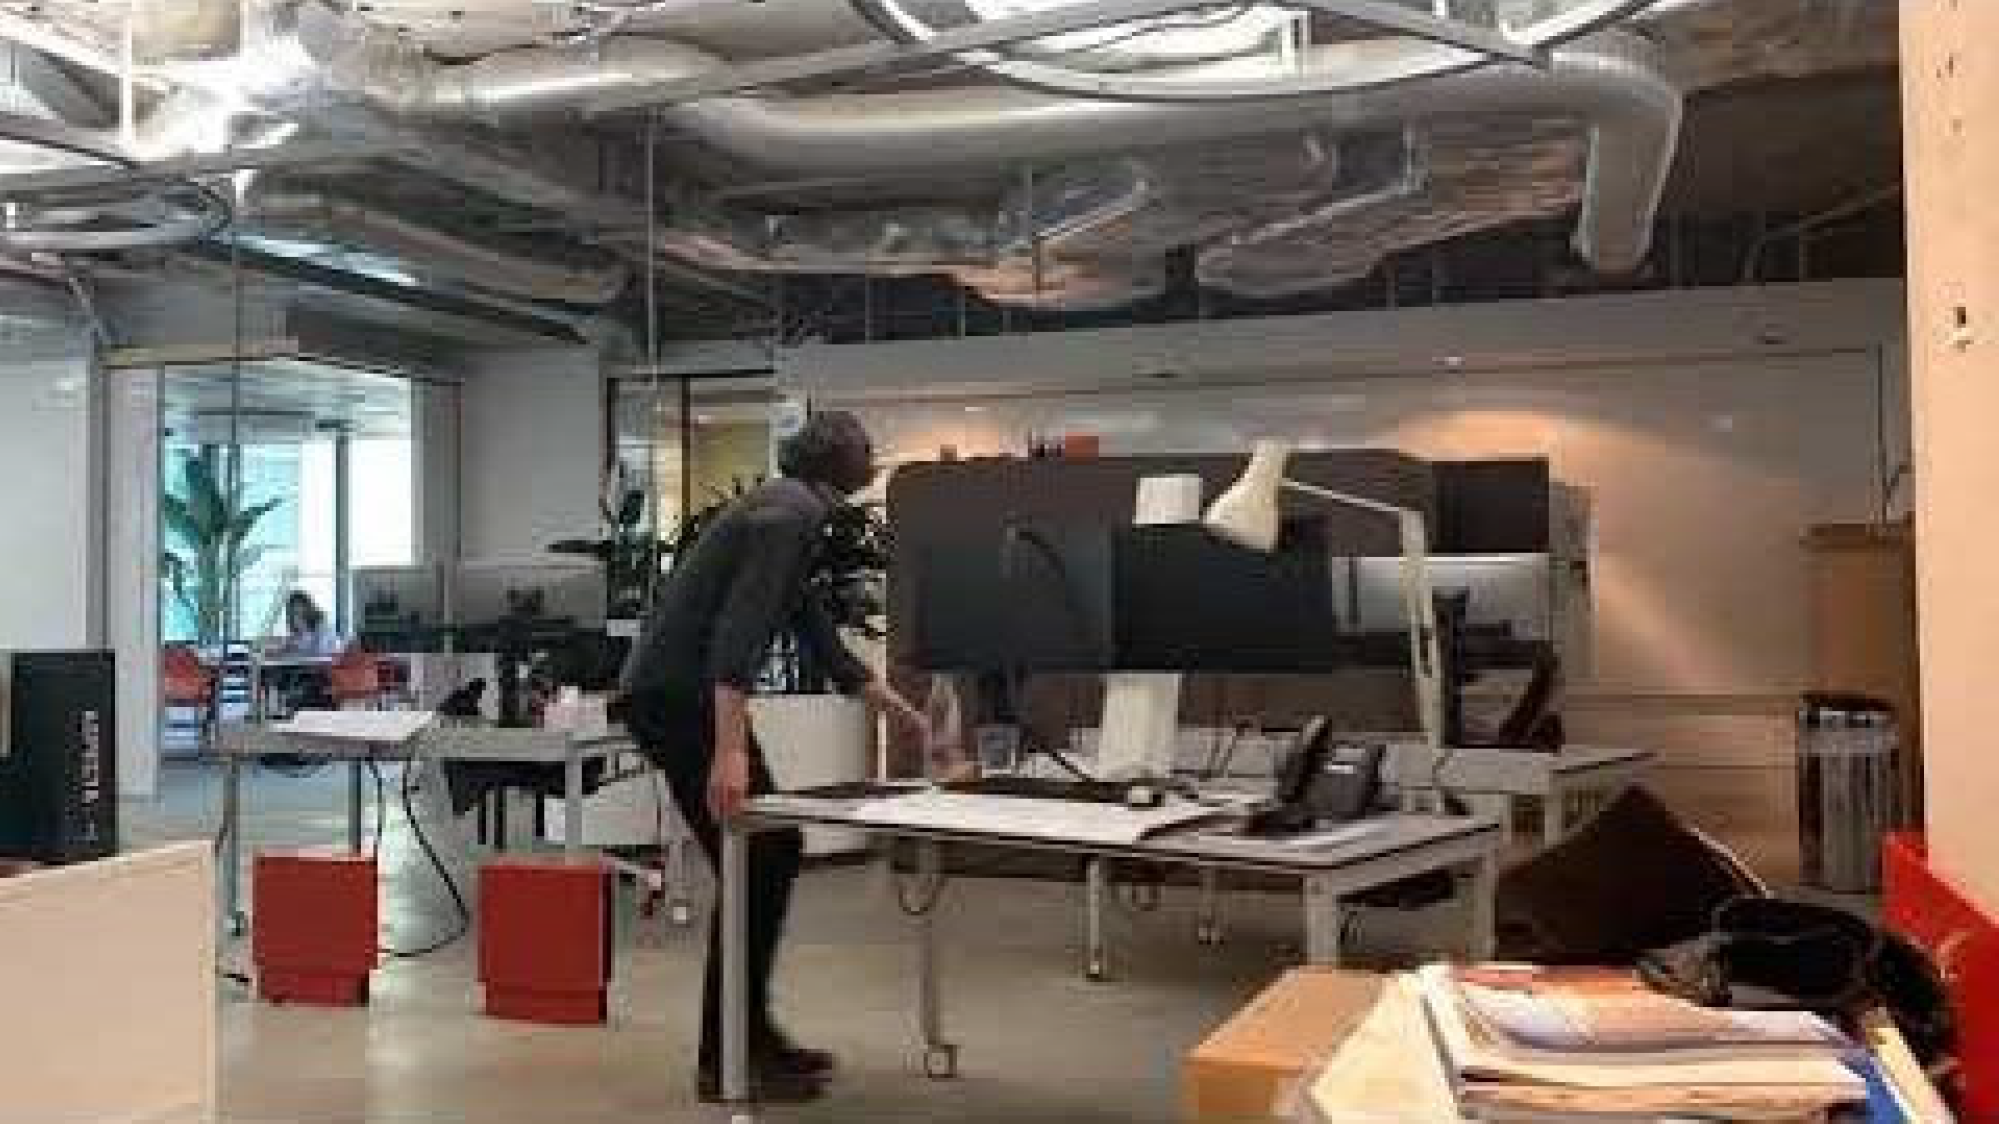
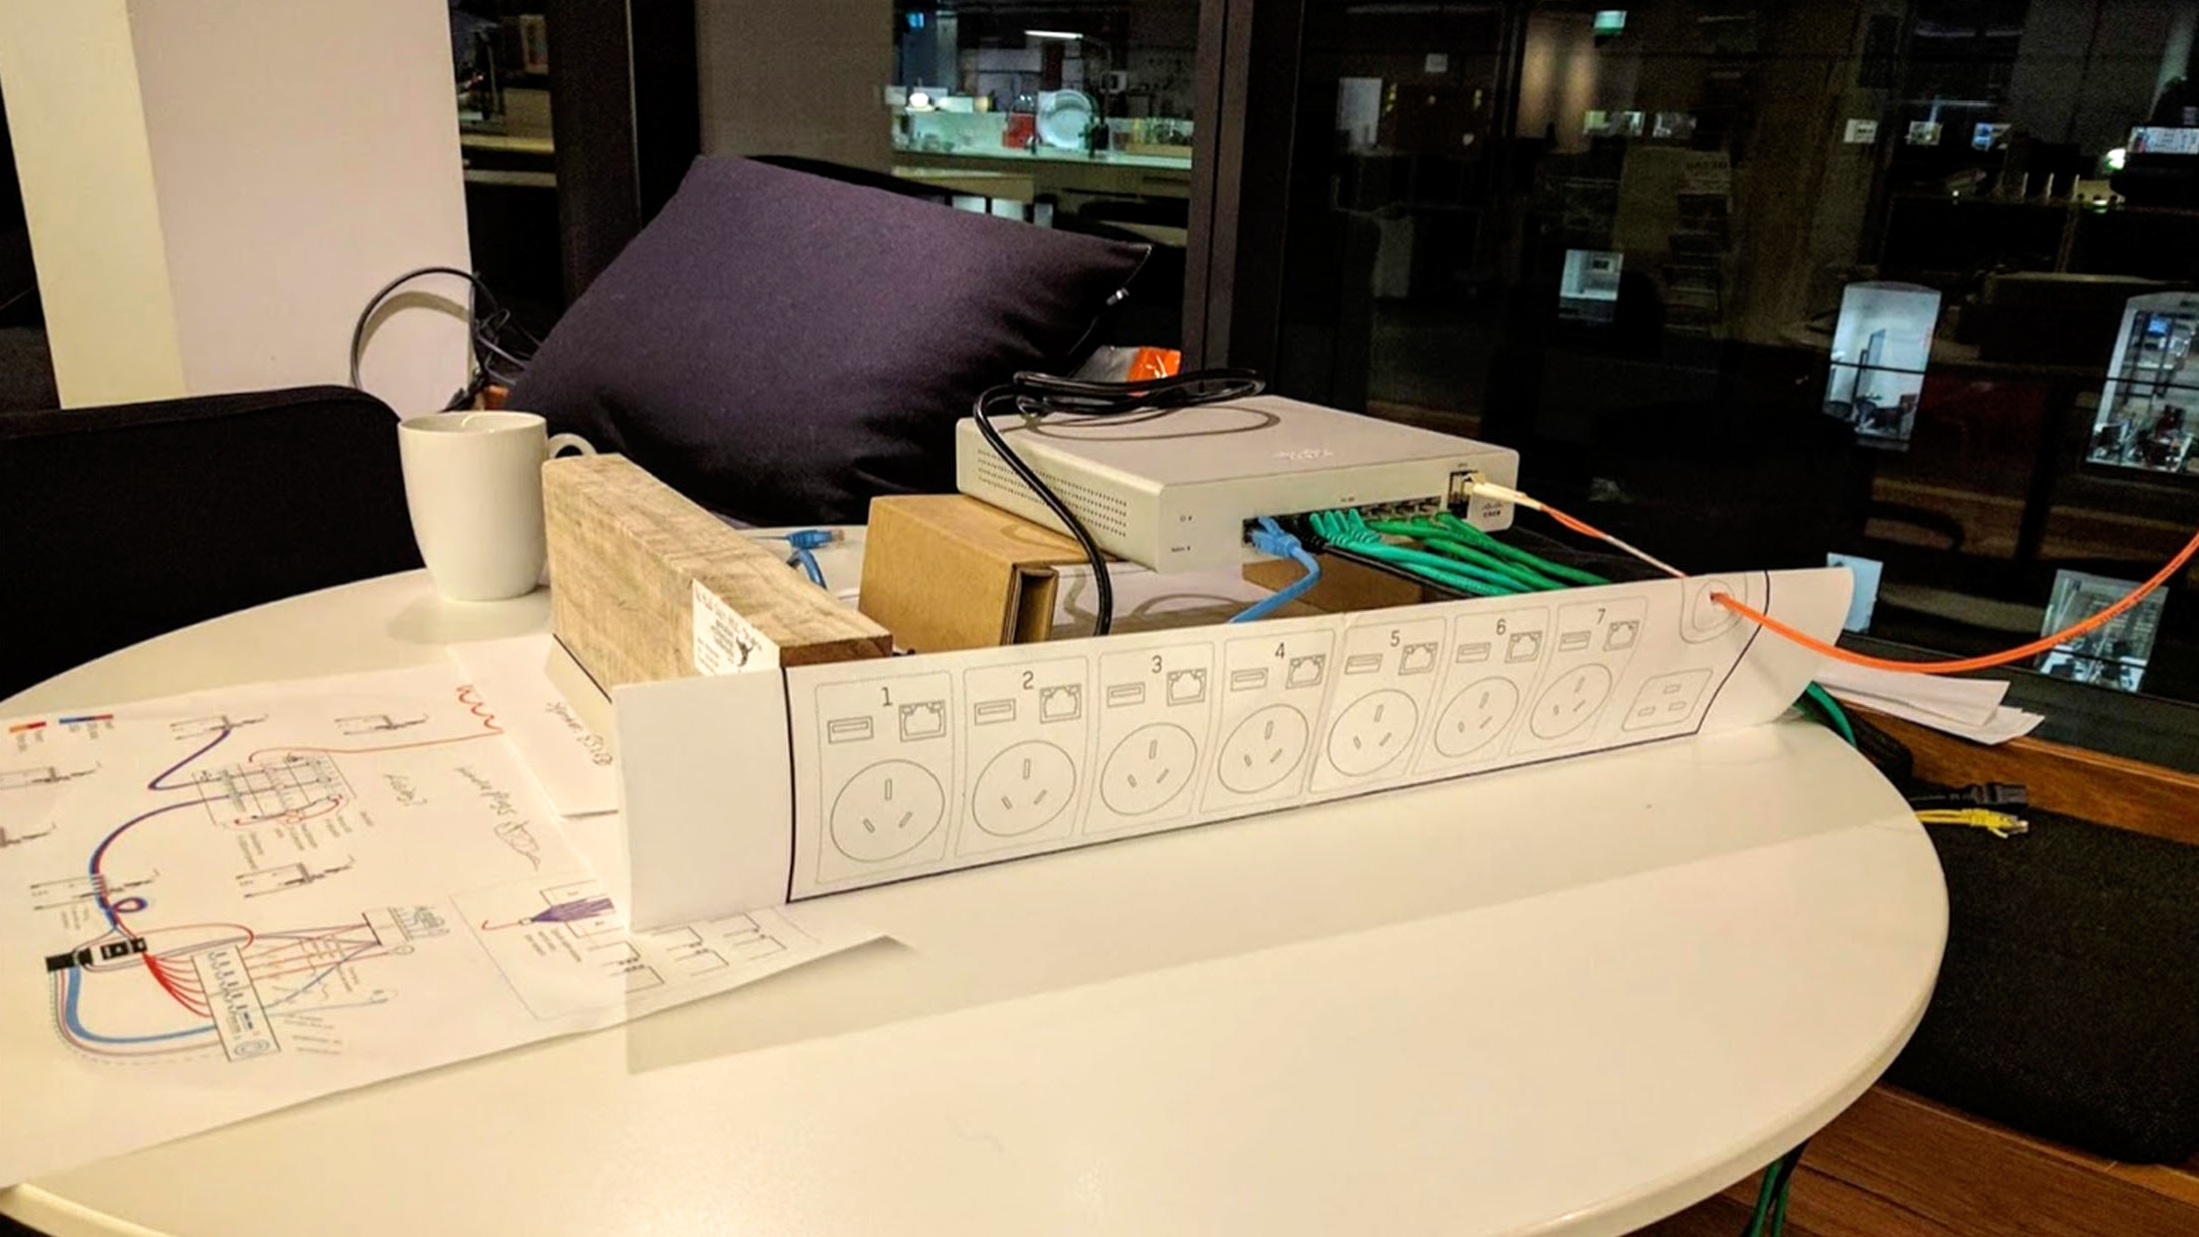
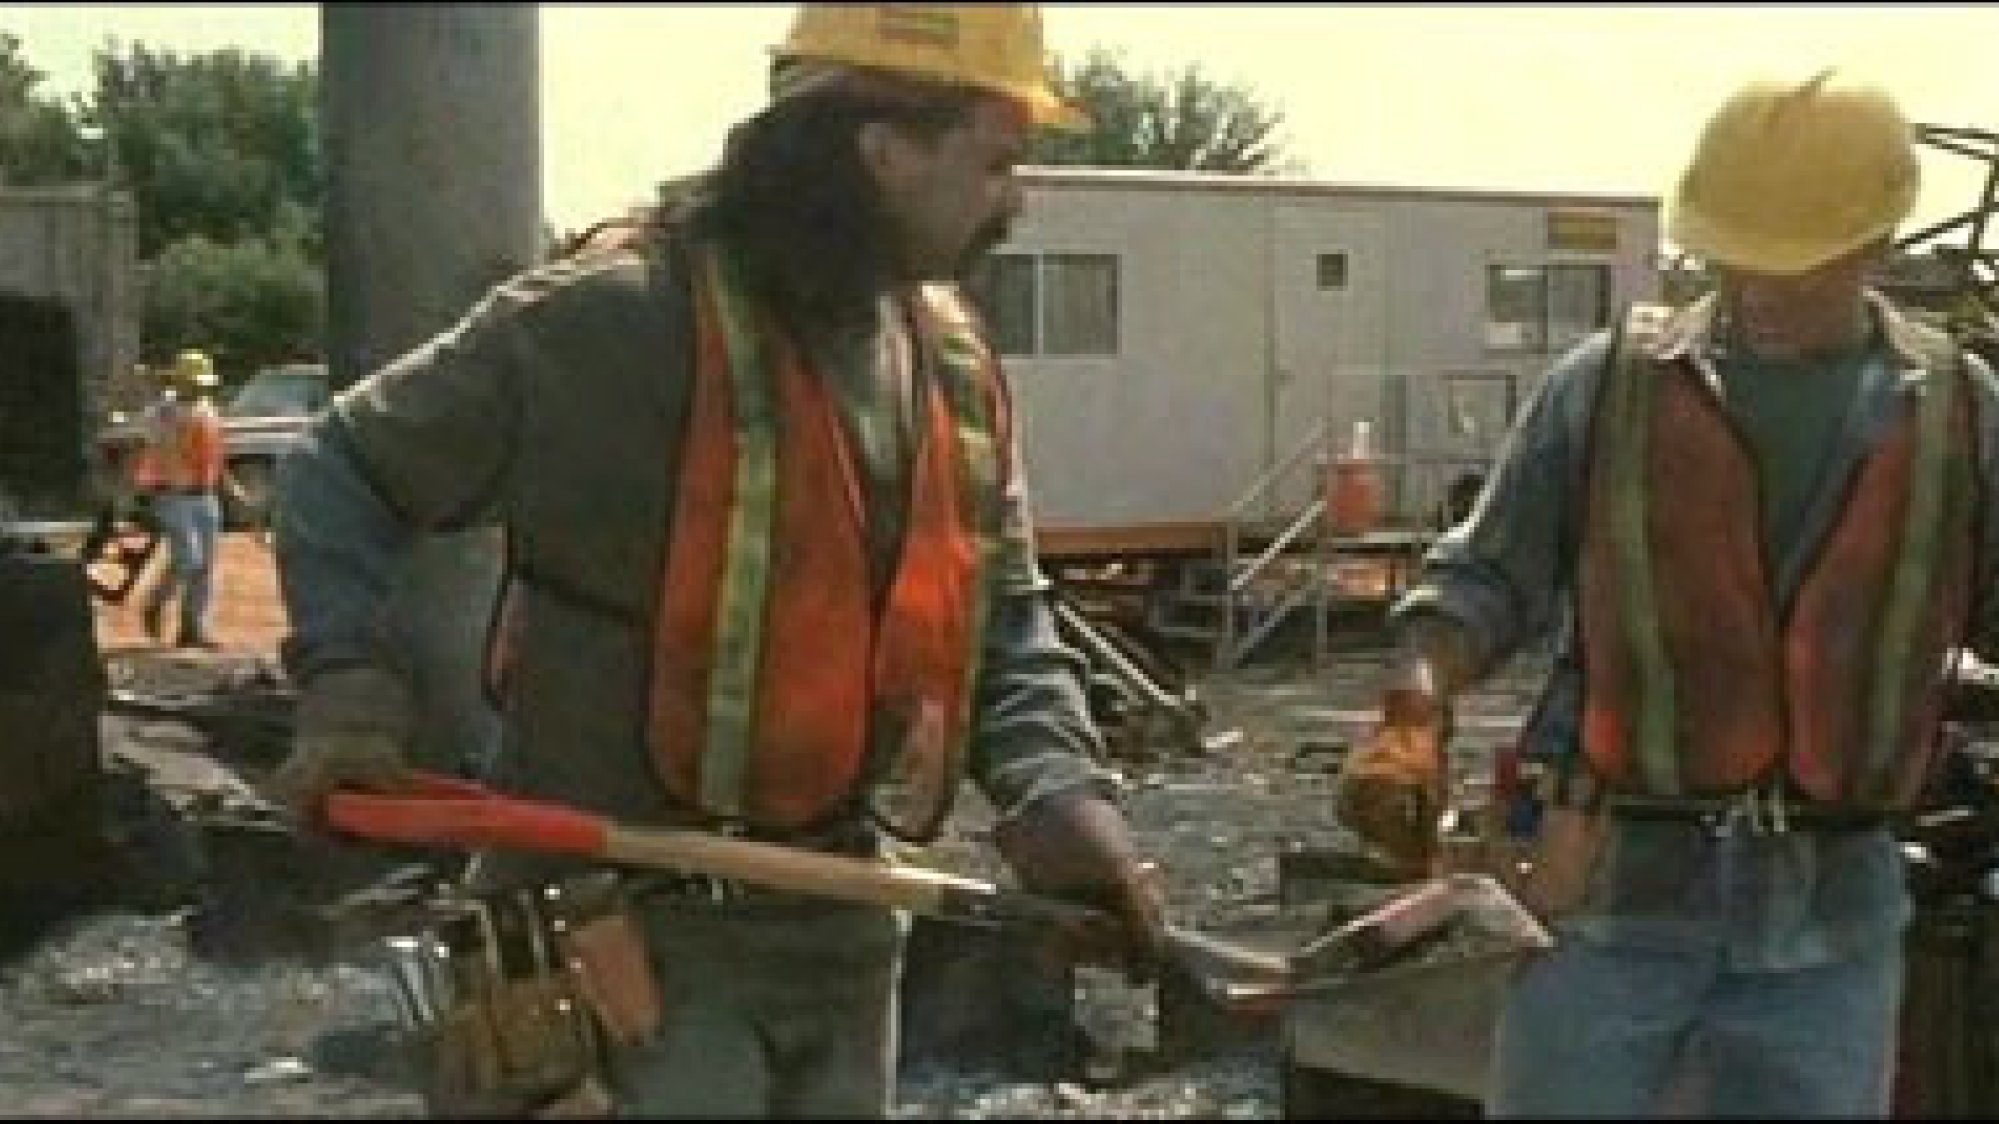
The catalyst for this project is that BVN Sydney now has fully mobile desks, something like Valve. This video shows an example of some moving.
If people can sit wherever they like, then why should they sit anywhere in particular? The more general problem is to fully layout an office given some knowledge of its occupants and goals (Including moving the desks), but we’re already pushing the limits of optimisation with our current, simplified goal of only assigning the people to the seats.
-
-
Our team was involved in some of the theoretical aspects of the implementation of this moving desk system. And some of the less theoretical parts too!
-
-
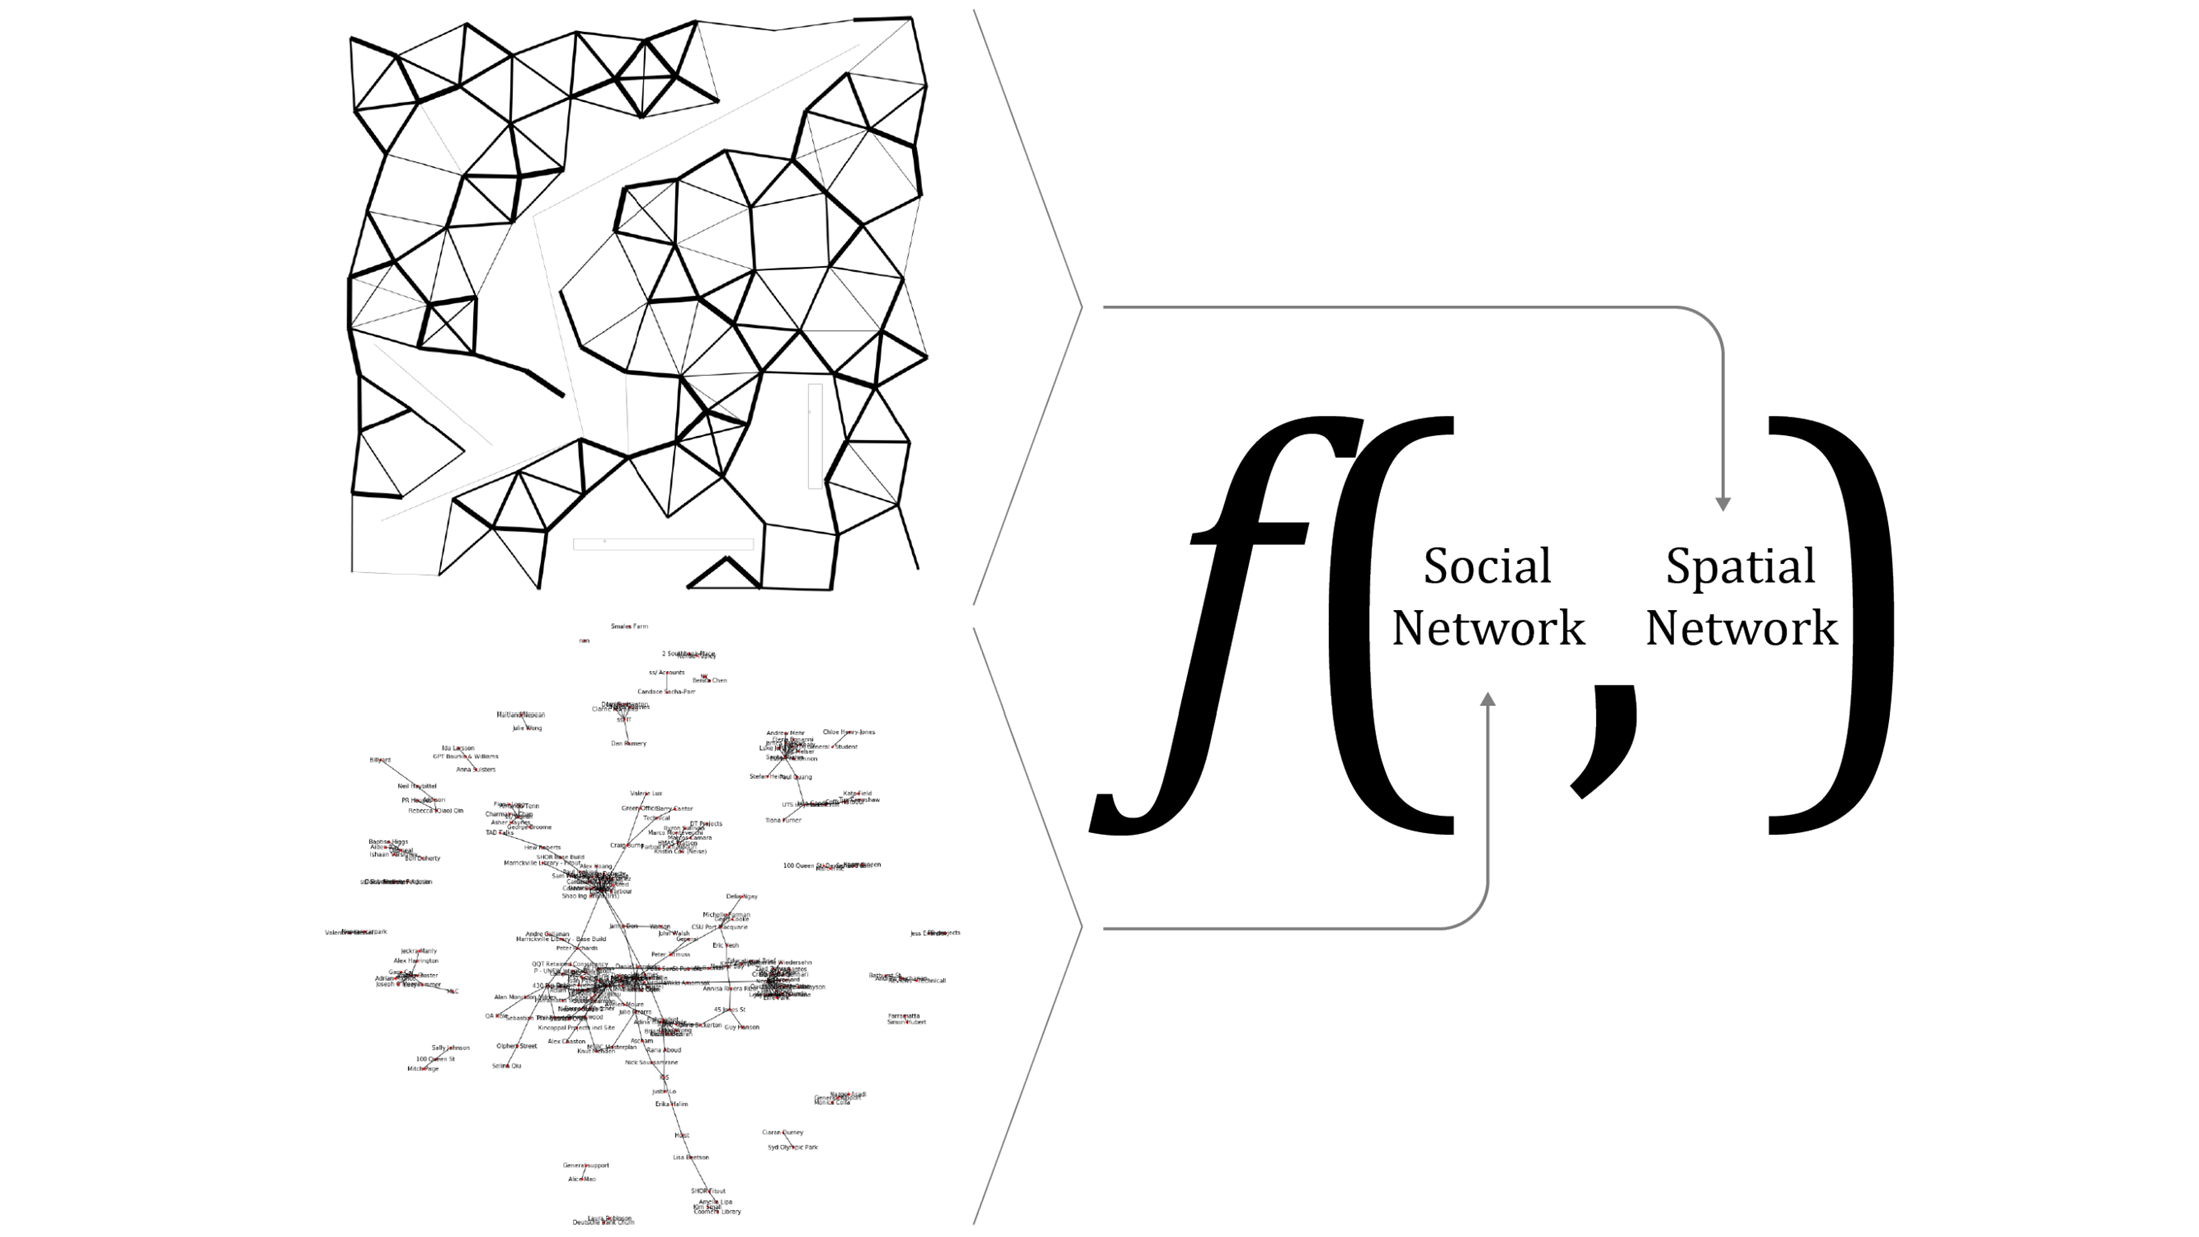
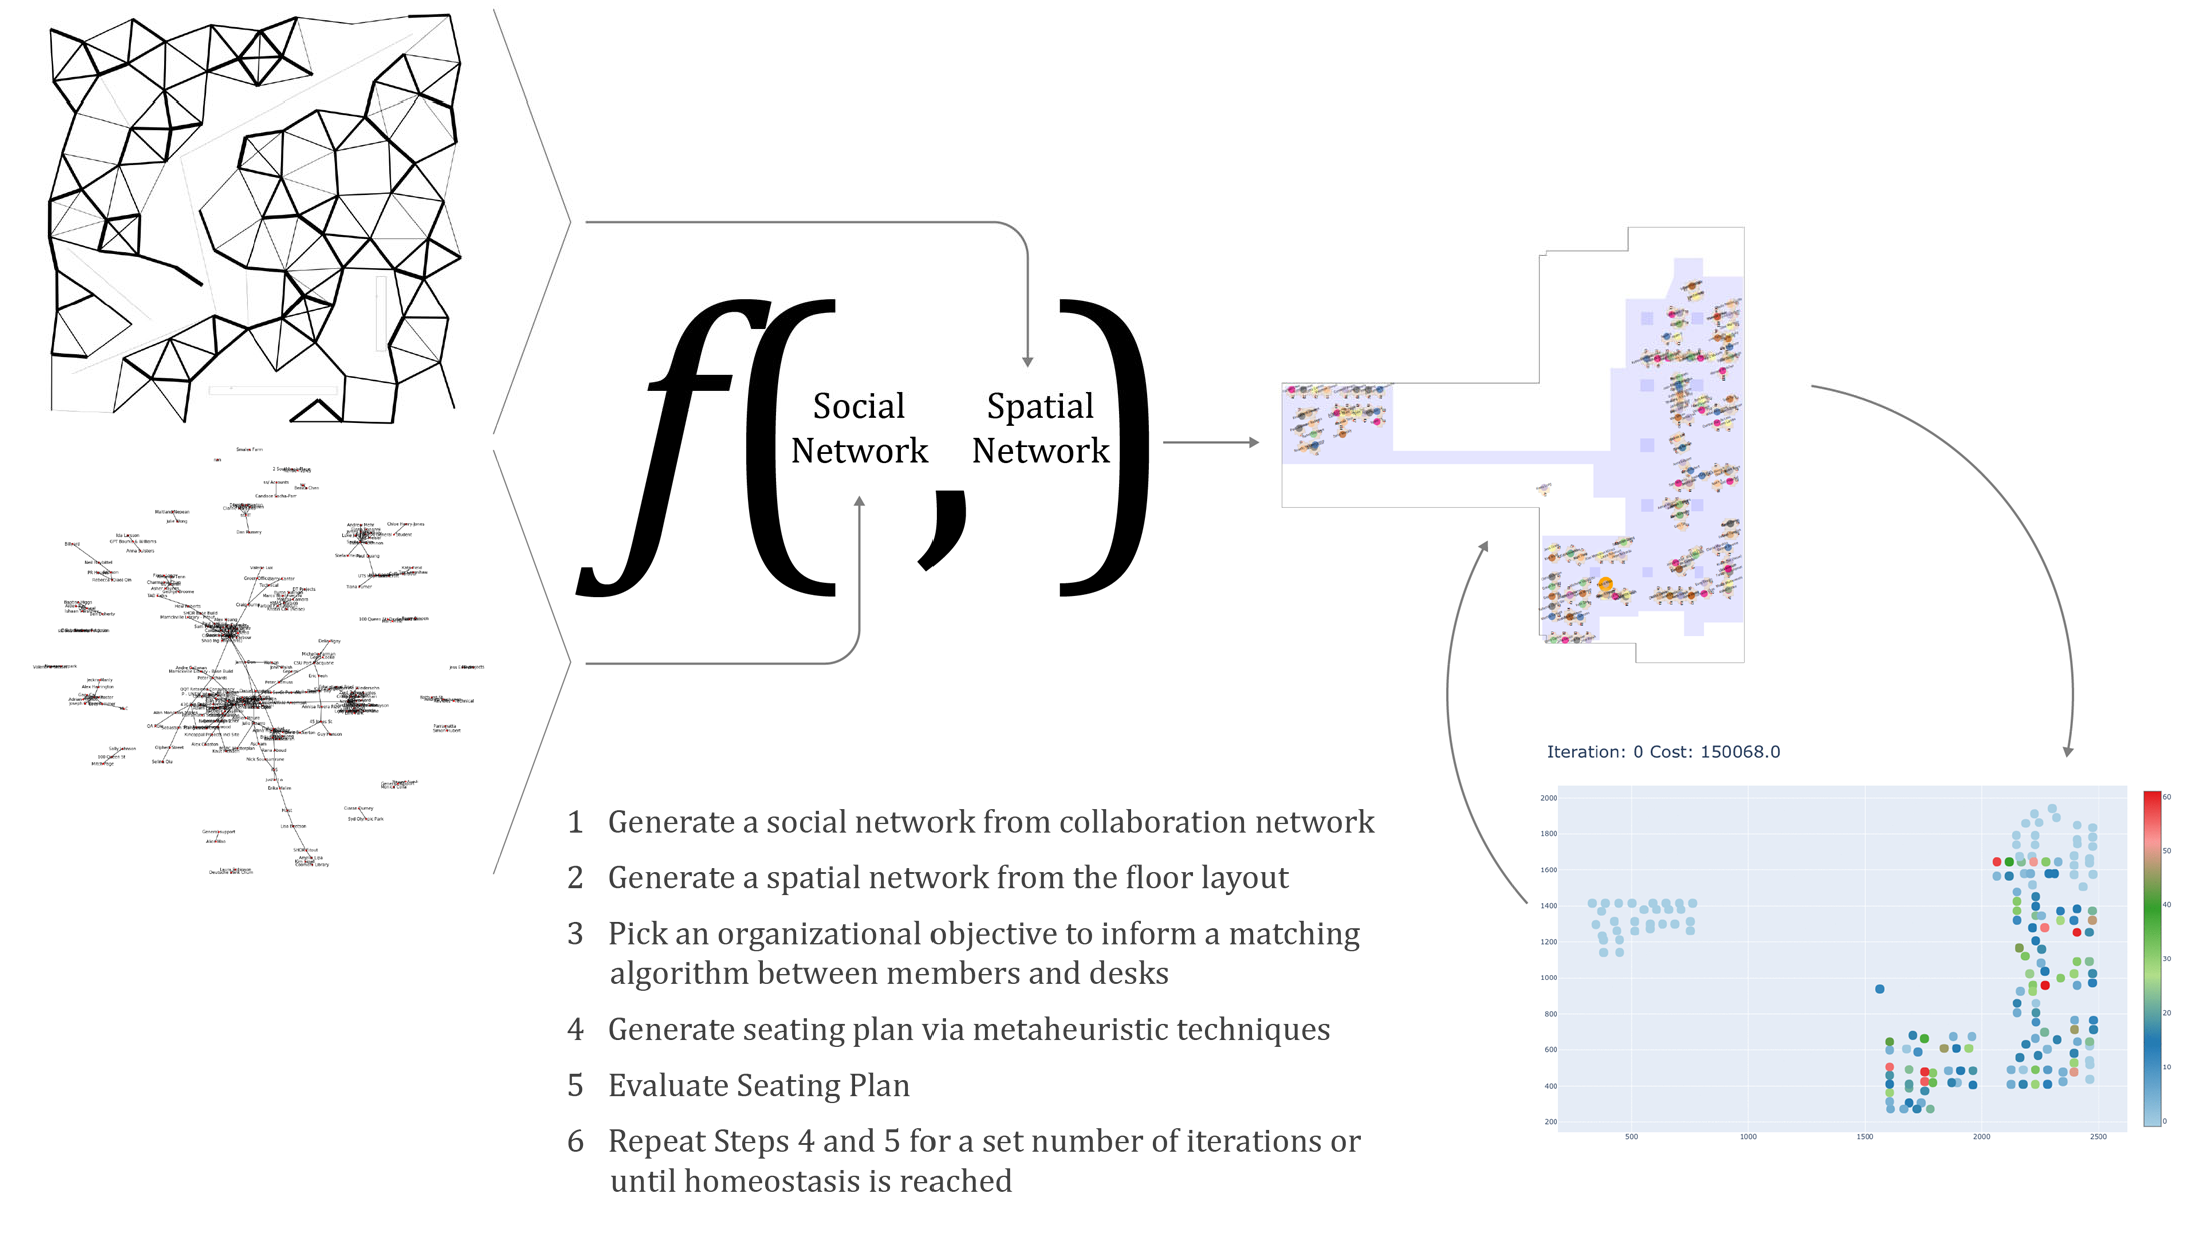
This lead Ishaan to conceive of the Plane of Thrones framework. It’s got 3 parts: a social network, a spatial network, and an objective function.
In the paper, we show a couple of toy examples, but it’s worth pointing out that this paper is essentially focused on the framework, the idea, and not on the particular implementation.
Coming at the problem from the objective function first, the toy example takes its goal to be team coherence, just from a geometric point of view, however, you could aim for:
- face-to-face communication: given an organization’s social network sit those who communicate often next to each other (Kendon 1990),
- inter-team communication (Burger et al. 2014),
- intra-team communication: grouping team-mates together, ideal if working with an organizational chart (Burger et al. 2014, Wineman, Kabo, and Davis 2008),
- speed of information diffusion: seat information brokers in such a way that information cascades are maximized (Allen and Cohen 1969),
- organizational learning i.e. learning from similar but unconnected colleagues (Lee 2017).
Or any other ideas that you have. (What if we sat people by height order or age, or by what TV shows they like, those kinds of idea, but less stupid).
This objective function needs to be fed a representation of the people and a representation of the space. We’re assuming a social network representation of the people. This could be of arbitrary complexity, and it actually took me a while to feel comfortable with that idea.
The social media networks that are pervasive in modern life are very rich, and the toy example uses only team membership as its edge type. I initially discounted this because it seemed too simple, but it has much better correspondence with the actual problem solved by our office managers.
-
-
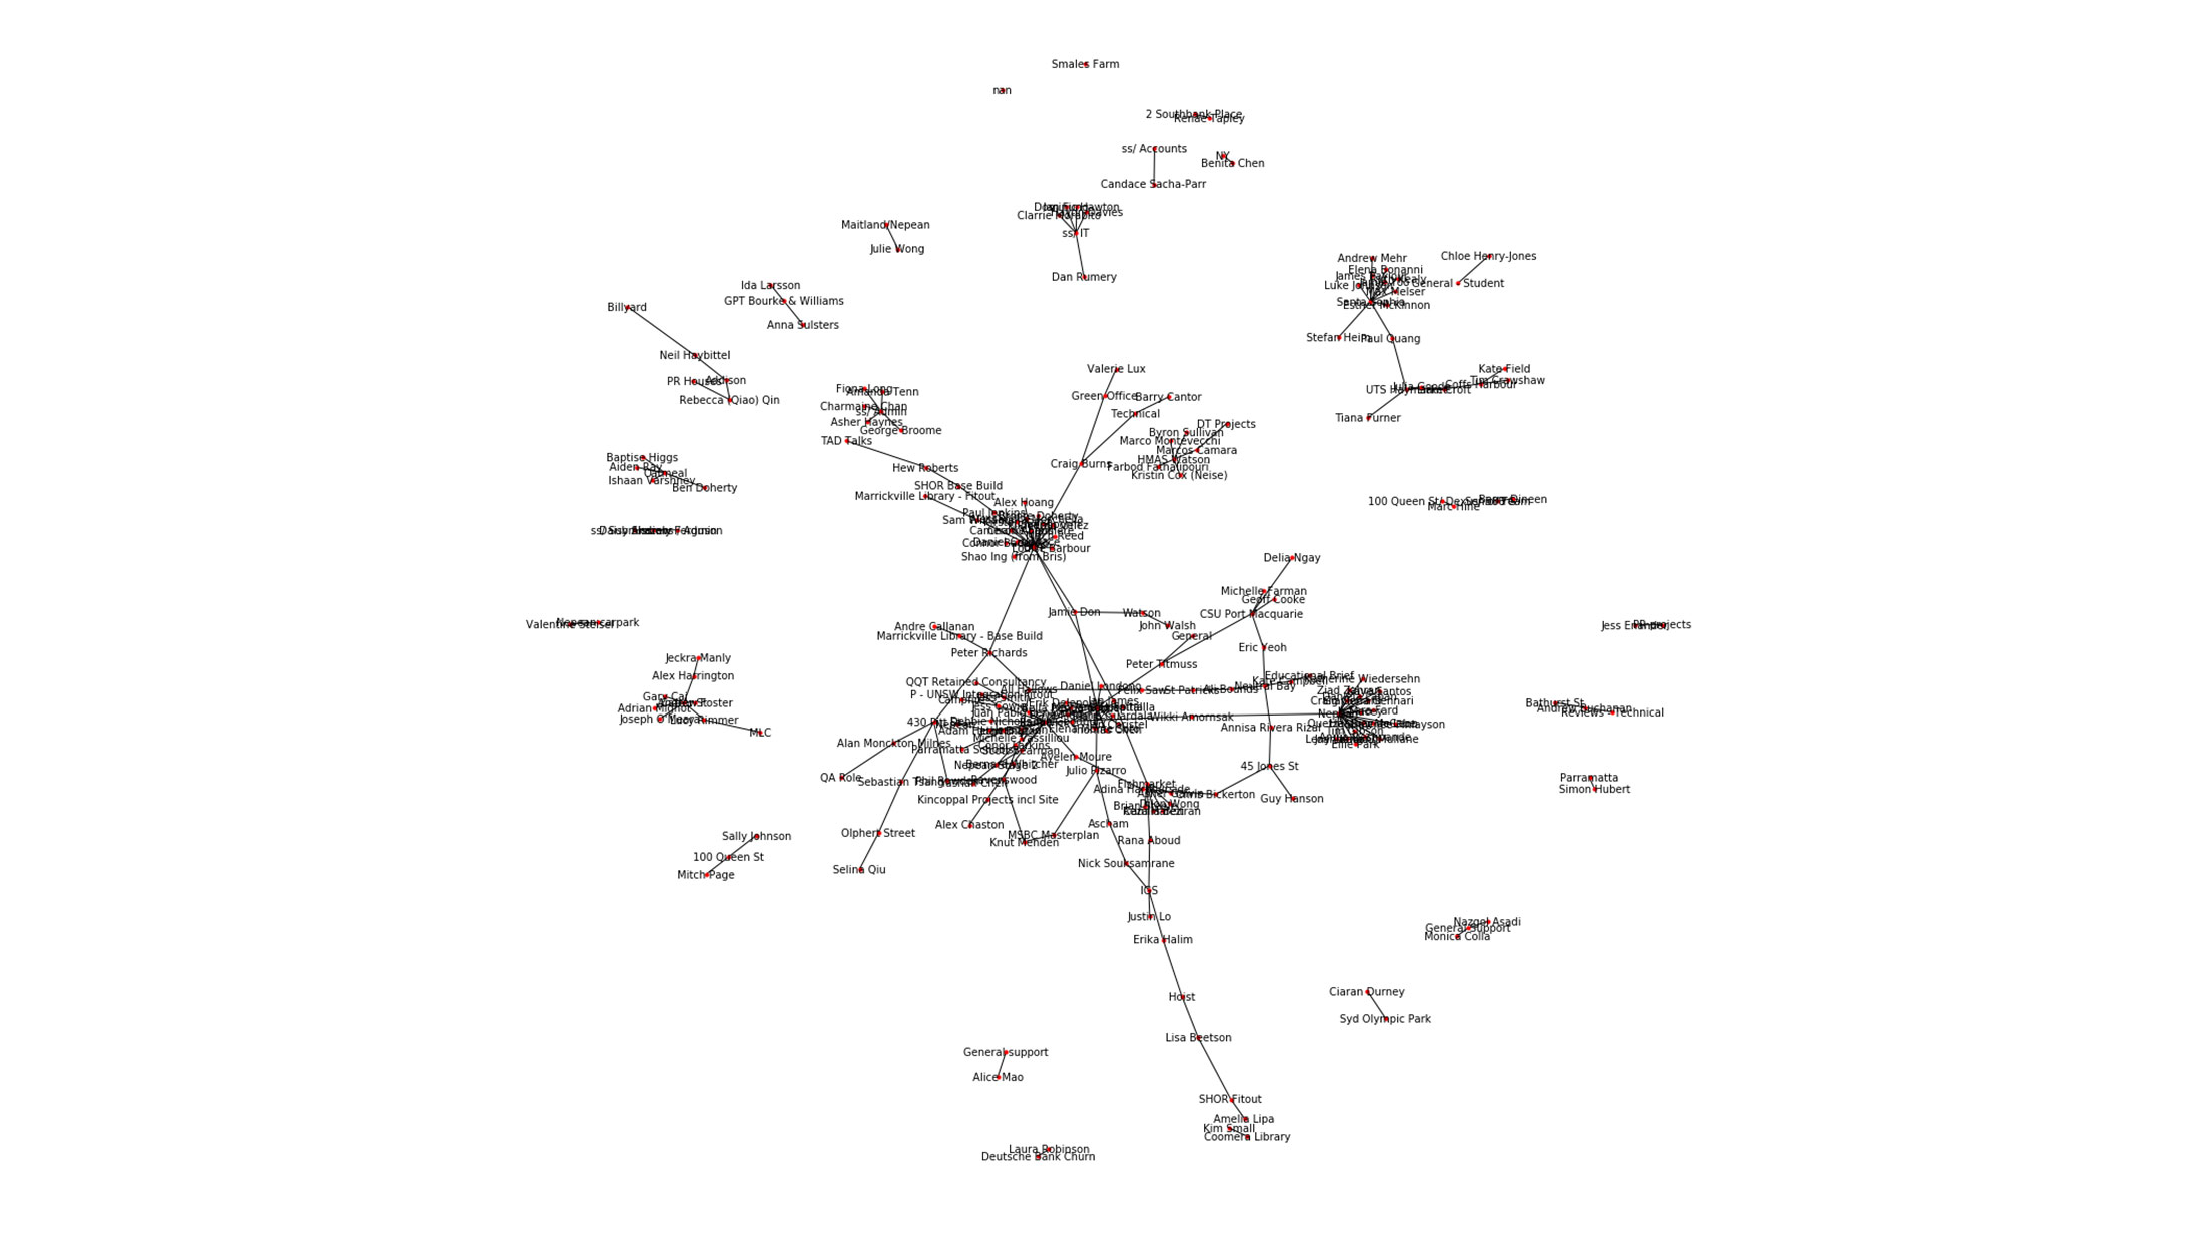
This is a graph representation of the relationship between people and projects. It already starts to suggest a sense of the way that information might flow through people via common projects. It could—and this is open to accusations of “building the diagram”—suggest where to place people to give team coherence. A more serious implementation could take much richer network data, with more data on the nodes (representing the people, e.g. skill/knowledge levels in different domains, time with the company, degree of introversion vs extroversion) and the edges (representing the relationship between those people, e.g. are those people friends? Lewis and Carroll (2016) had a crack at this problem, but they took the less constraining approach of dictating who couldn’t sit at the same table as someone else, which is a much sparser graph.
-
-
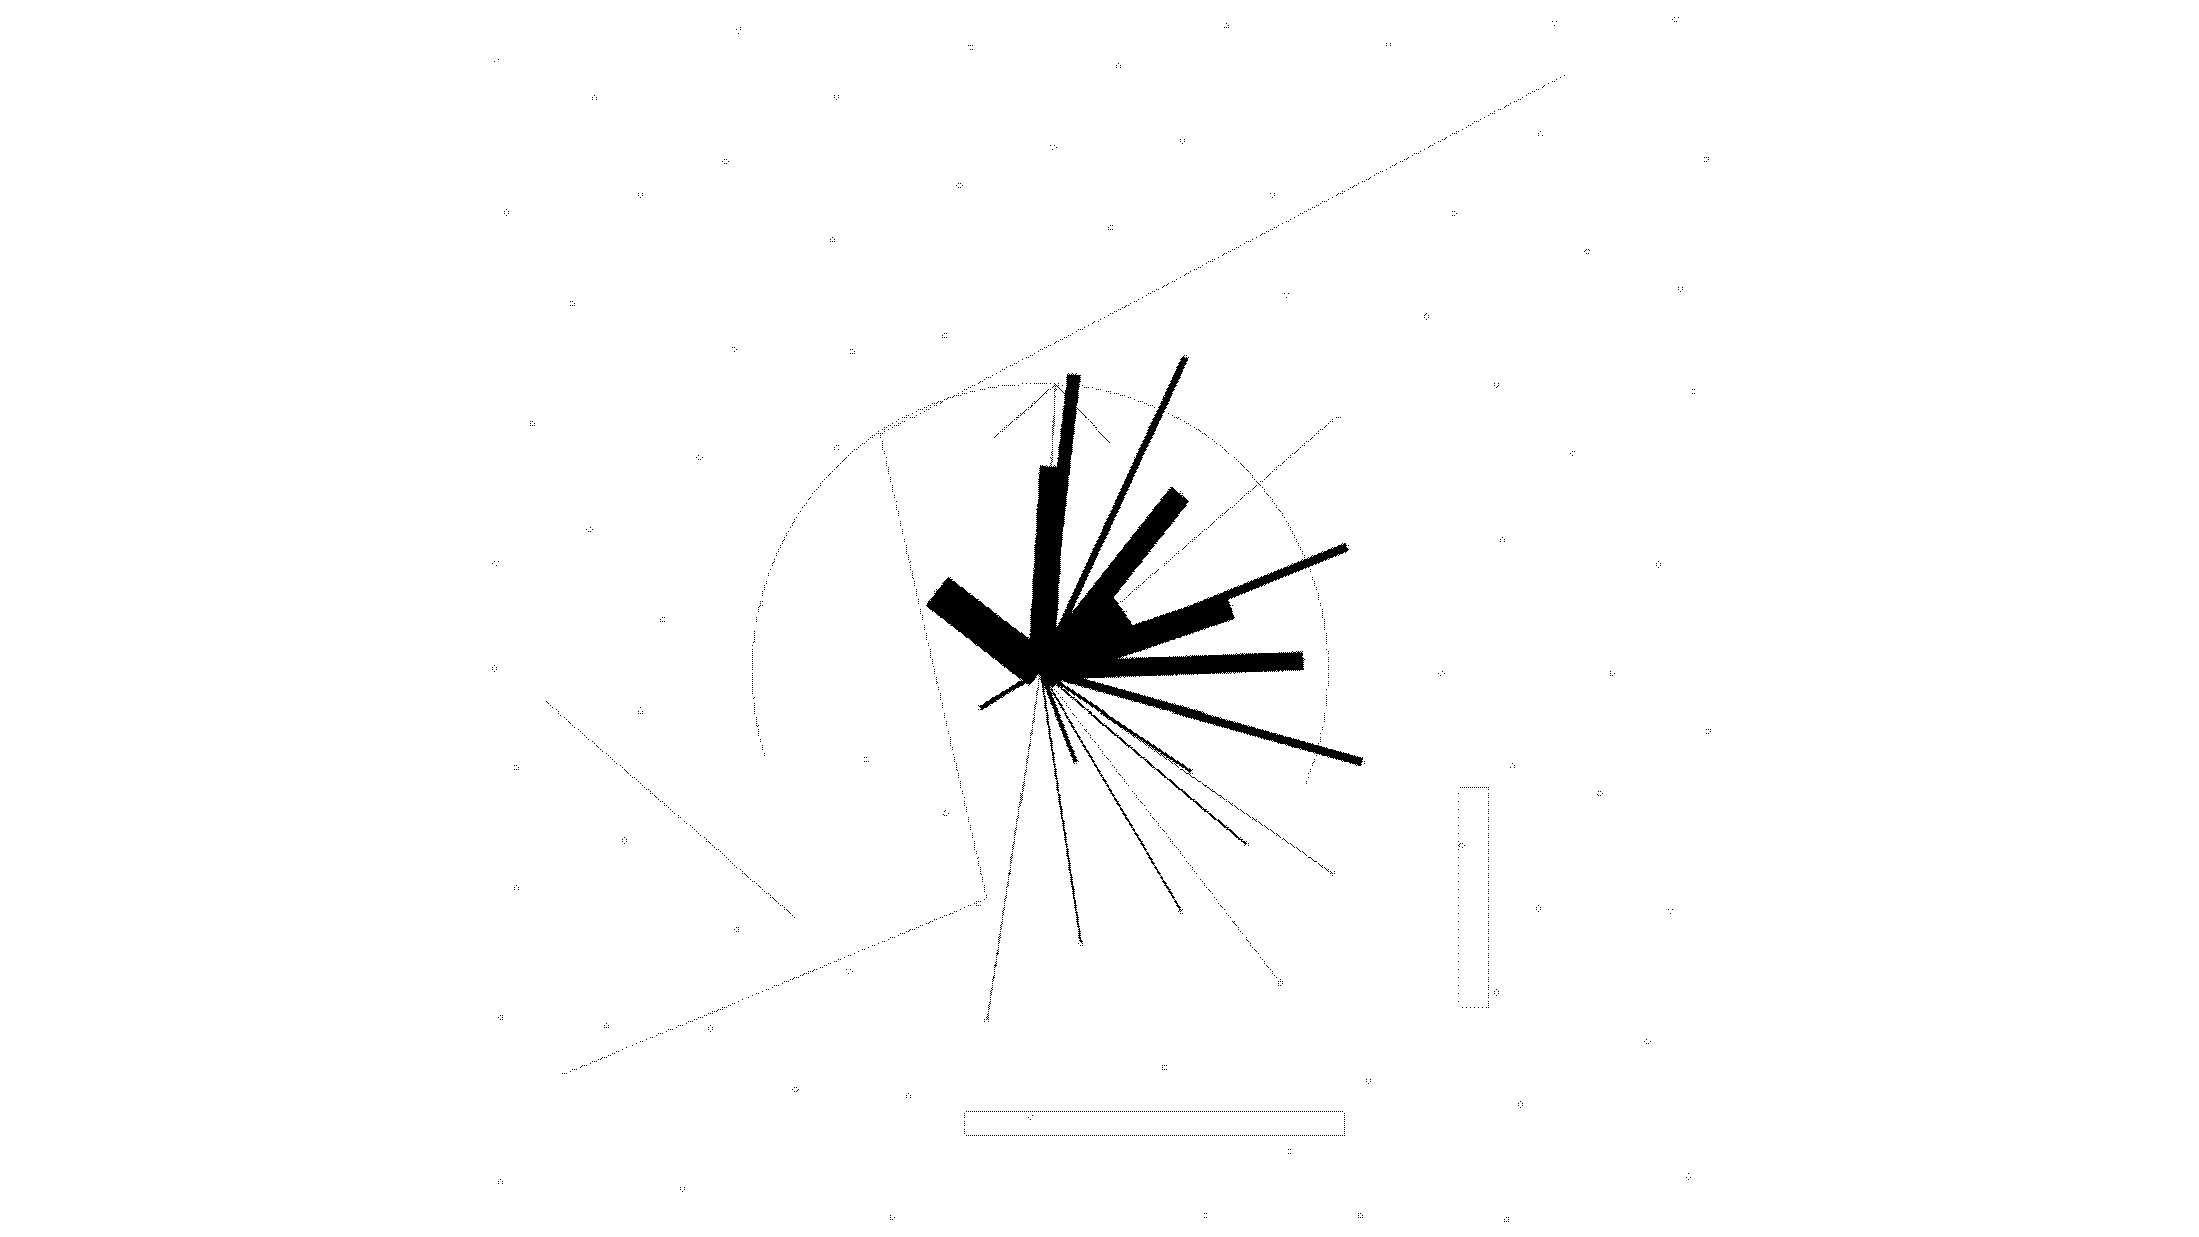
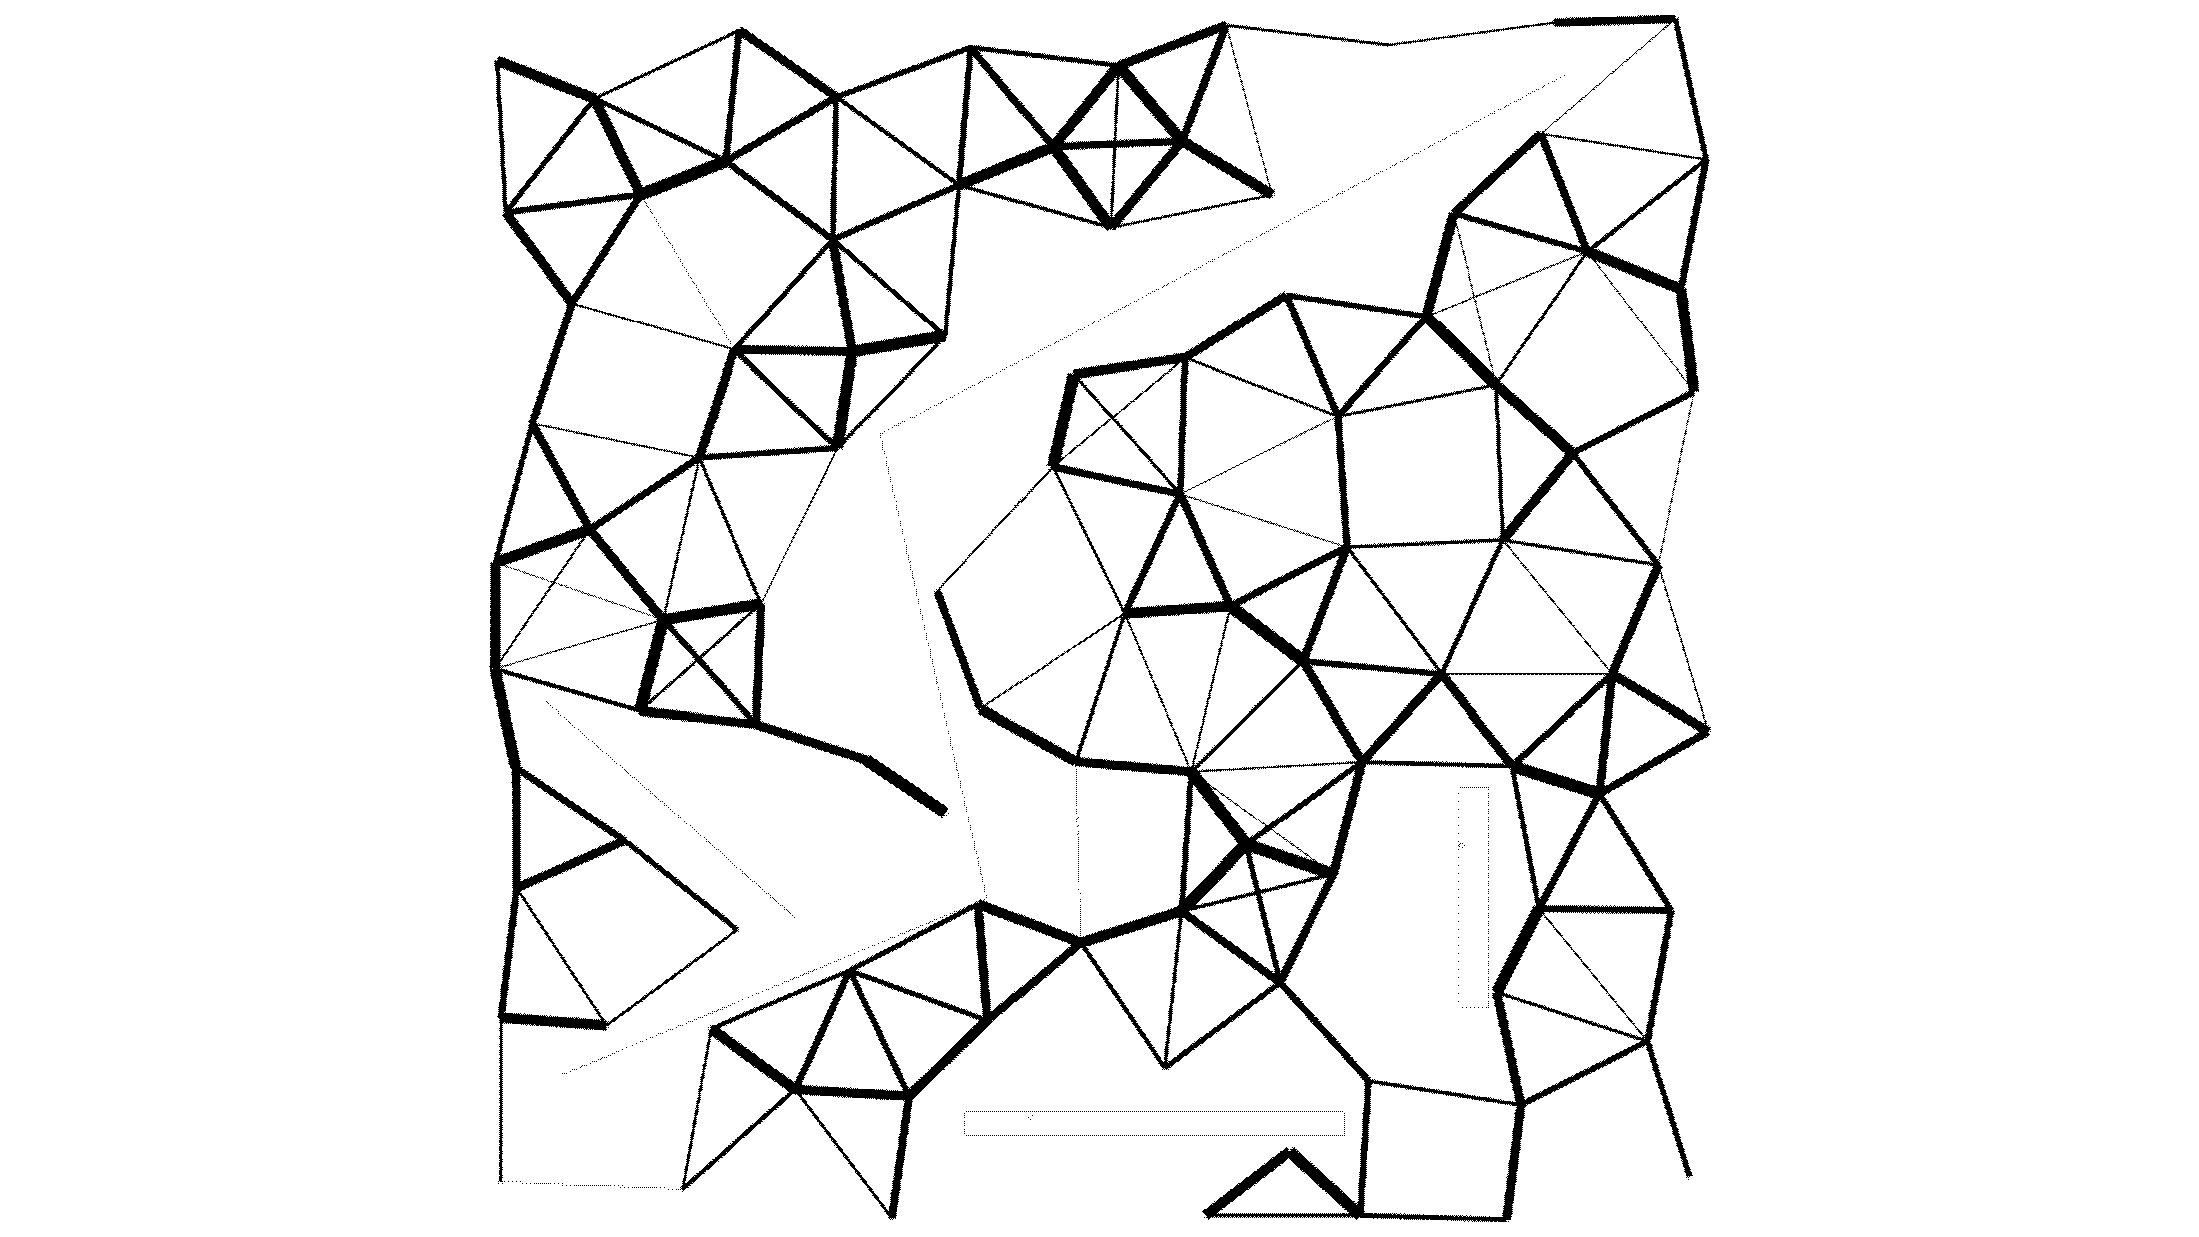
The spatial network components, FOV, obstructions, distance
-
-
All to all The spatial network is an area that seems to deserve more research. Does proximity rank above line of sight in an office environment? Perhaps someone from the Space Syntax world has a deeper understanding? For our example we’ve taken a combination of proximity, line of sight and view cone, as a an intuitively reasonable spatial network. (Remember that we’re posing this as a framework, not an implementation. Other things are almost certainly important, e.g. Walking distance comes to mind.)
-

-
This paper mainly presents three components, the lit review, the algorithm and a presentation layer. The lit review is fascinating, but in the interest of time, you can read it yourself.
-
-
Algorithm stuff
steps 4 and 5 == magic
Step 4:
- Given there are n! many number of seating plan possibilities we need a reasonable method of evaluating this solution space. A plain old GA didn’t cut it. We modified it such that it would place teams contiguously in the social network. Now it optimises best for multiple team membership. Emergent strategy. The genetic algorithm is nothing crazy: Keep the best two plans. Generate the rest with the 2 best crossed over with a fair bit of mutation. Here are the numbers but they don’t really make or break the algo:
- 10k generations
- 50 pop size
- Retain top 15%
- Crossover single cut crossover, top 2 go through, random picking
Step 5: the cost function
For each person we calculate how far away they are from their teammates then we calculate the distance based on the shortest path to that teammate in the spatial network. This helps us nicely calculate overall utility. We also experimented with linear and exponential penalties you reach a certain point where them being 10 steps away is more or less as bad as 20 steps away. So an exponential cost function is more aggressive in getting the algorithm to keep people together.
-
-
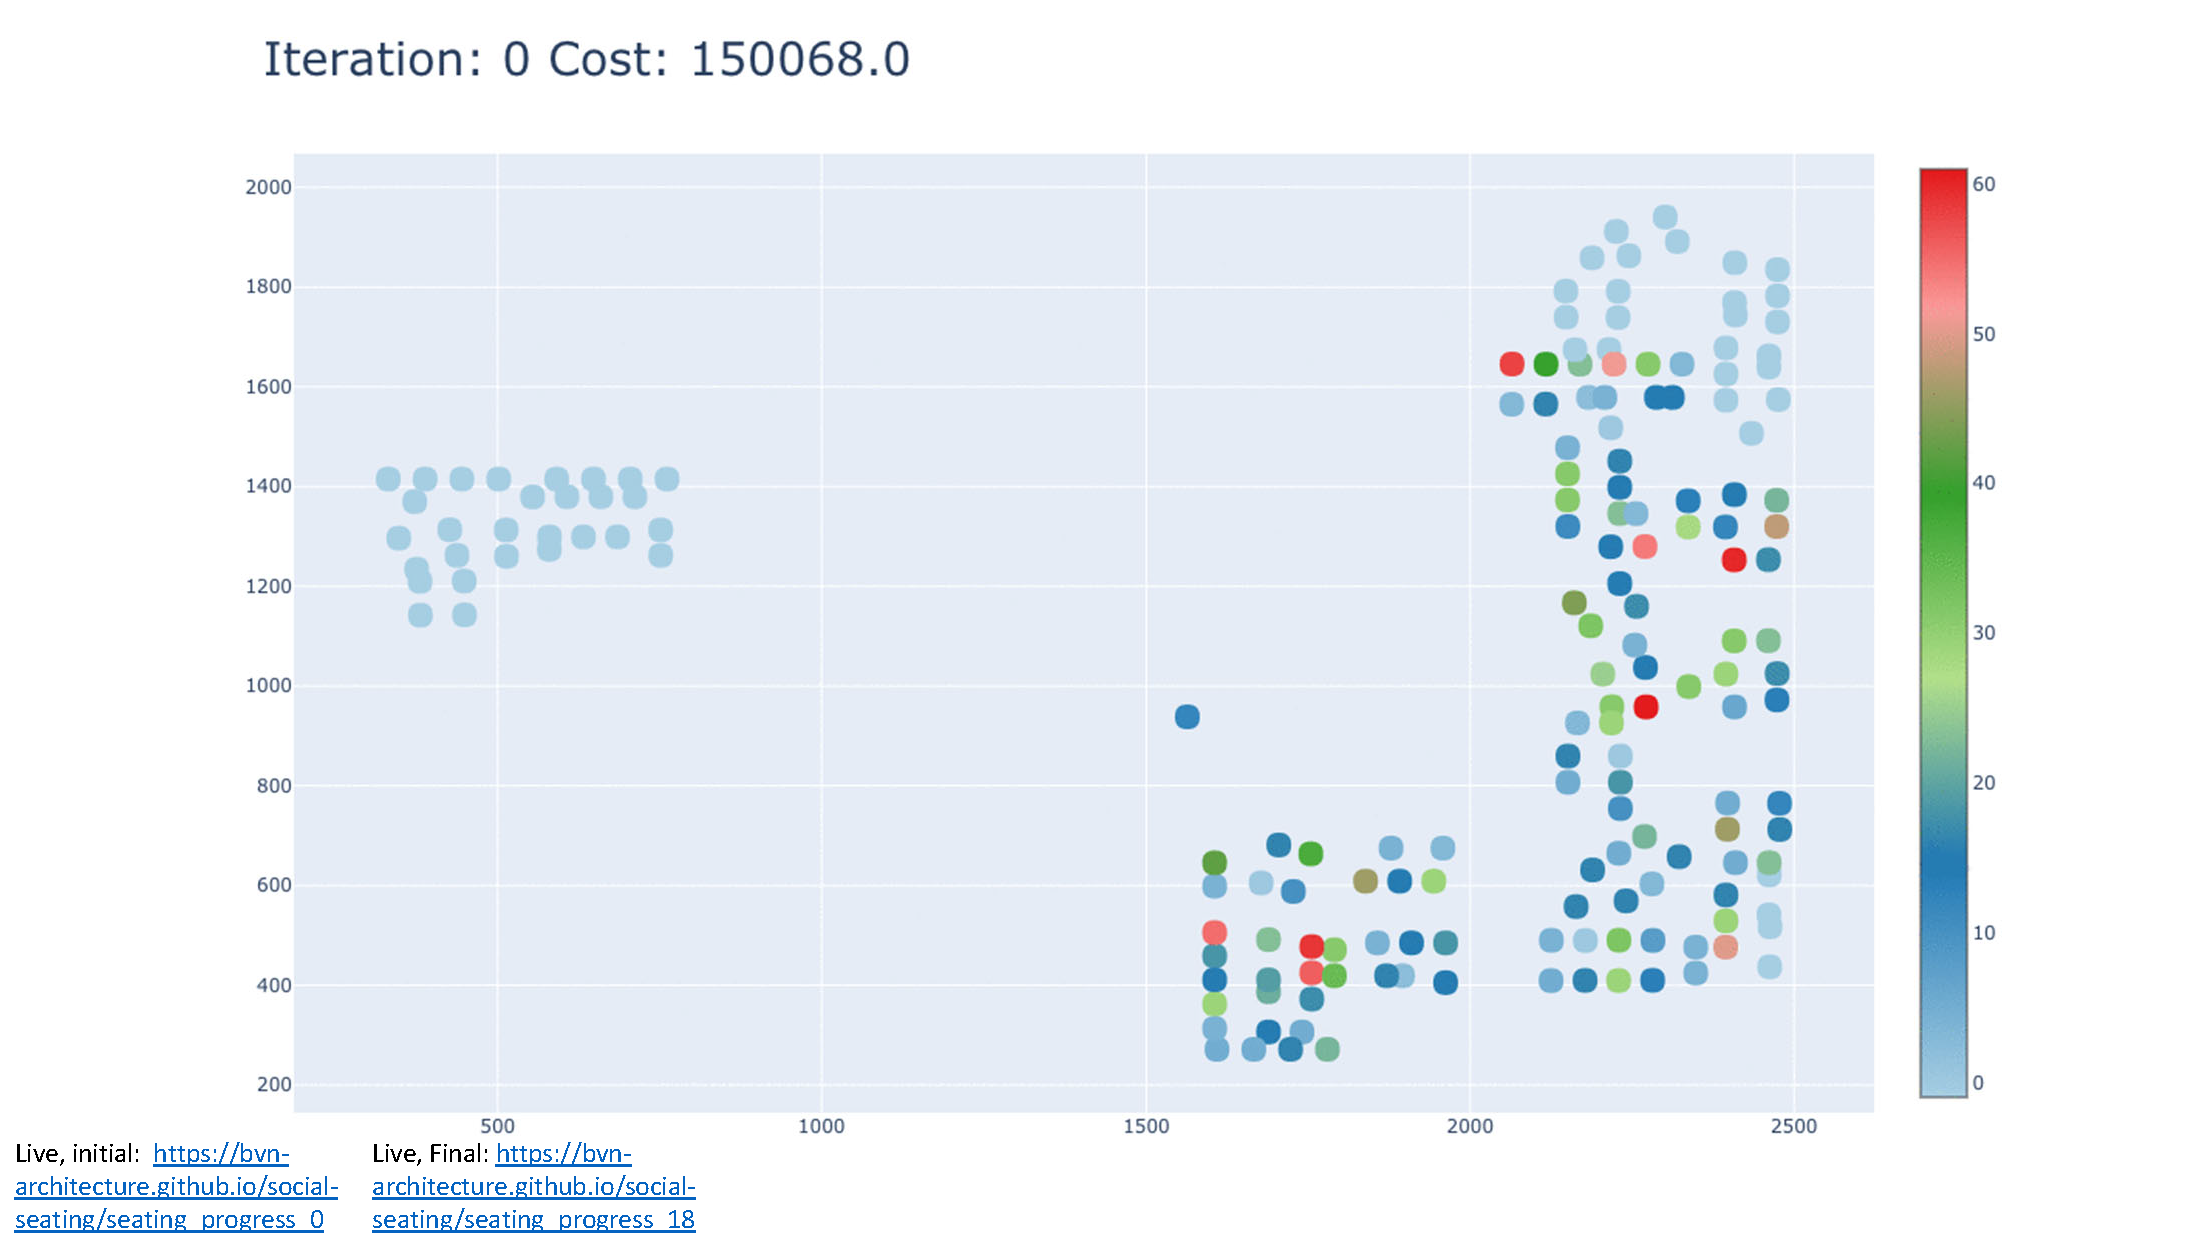
This shows randomly distributed people being allocated seats by the algorithm over time. Each generation teams get a little more contiguous.
We have only implemented the cost function for proximity, others would also need from GA friendly modification to make it work well.
Live, initial: https://bvn-architecture.github.io/social-seating/seating_progress_0
Live, Final: https://bvn-architecture.github.io/social-seating/seating_progress_18
-
-
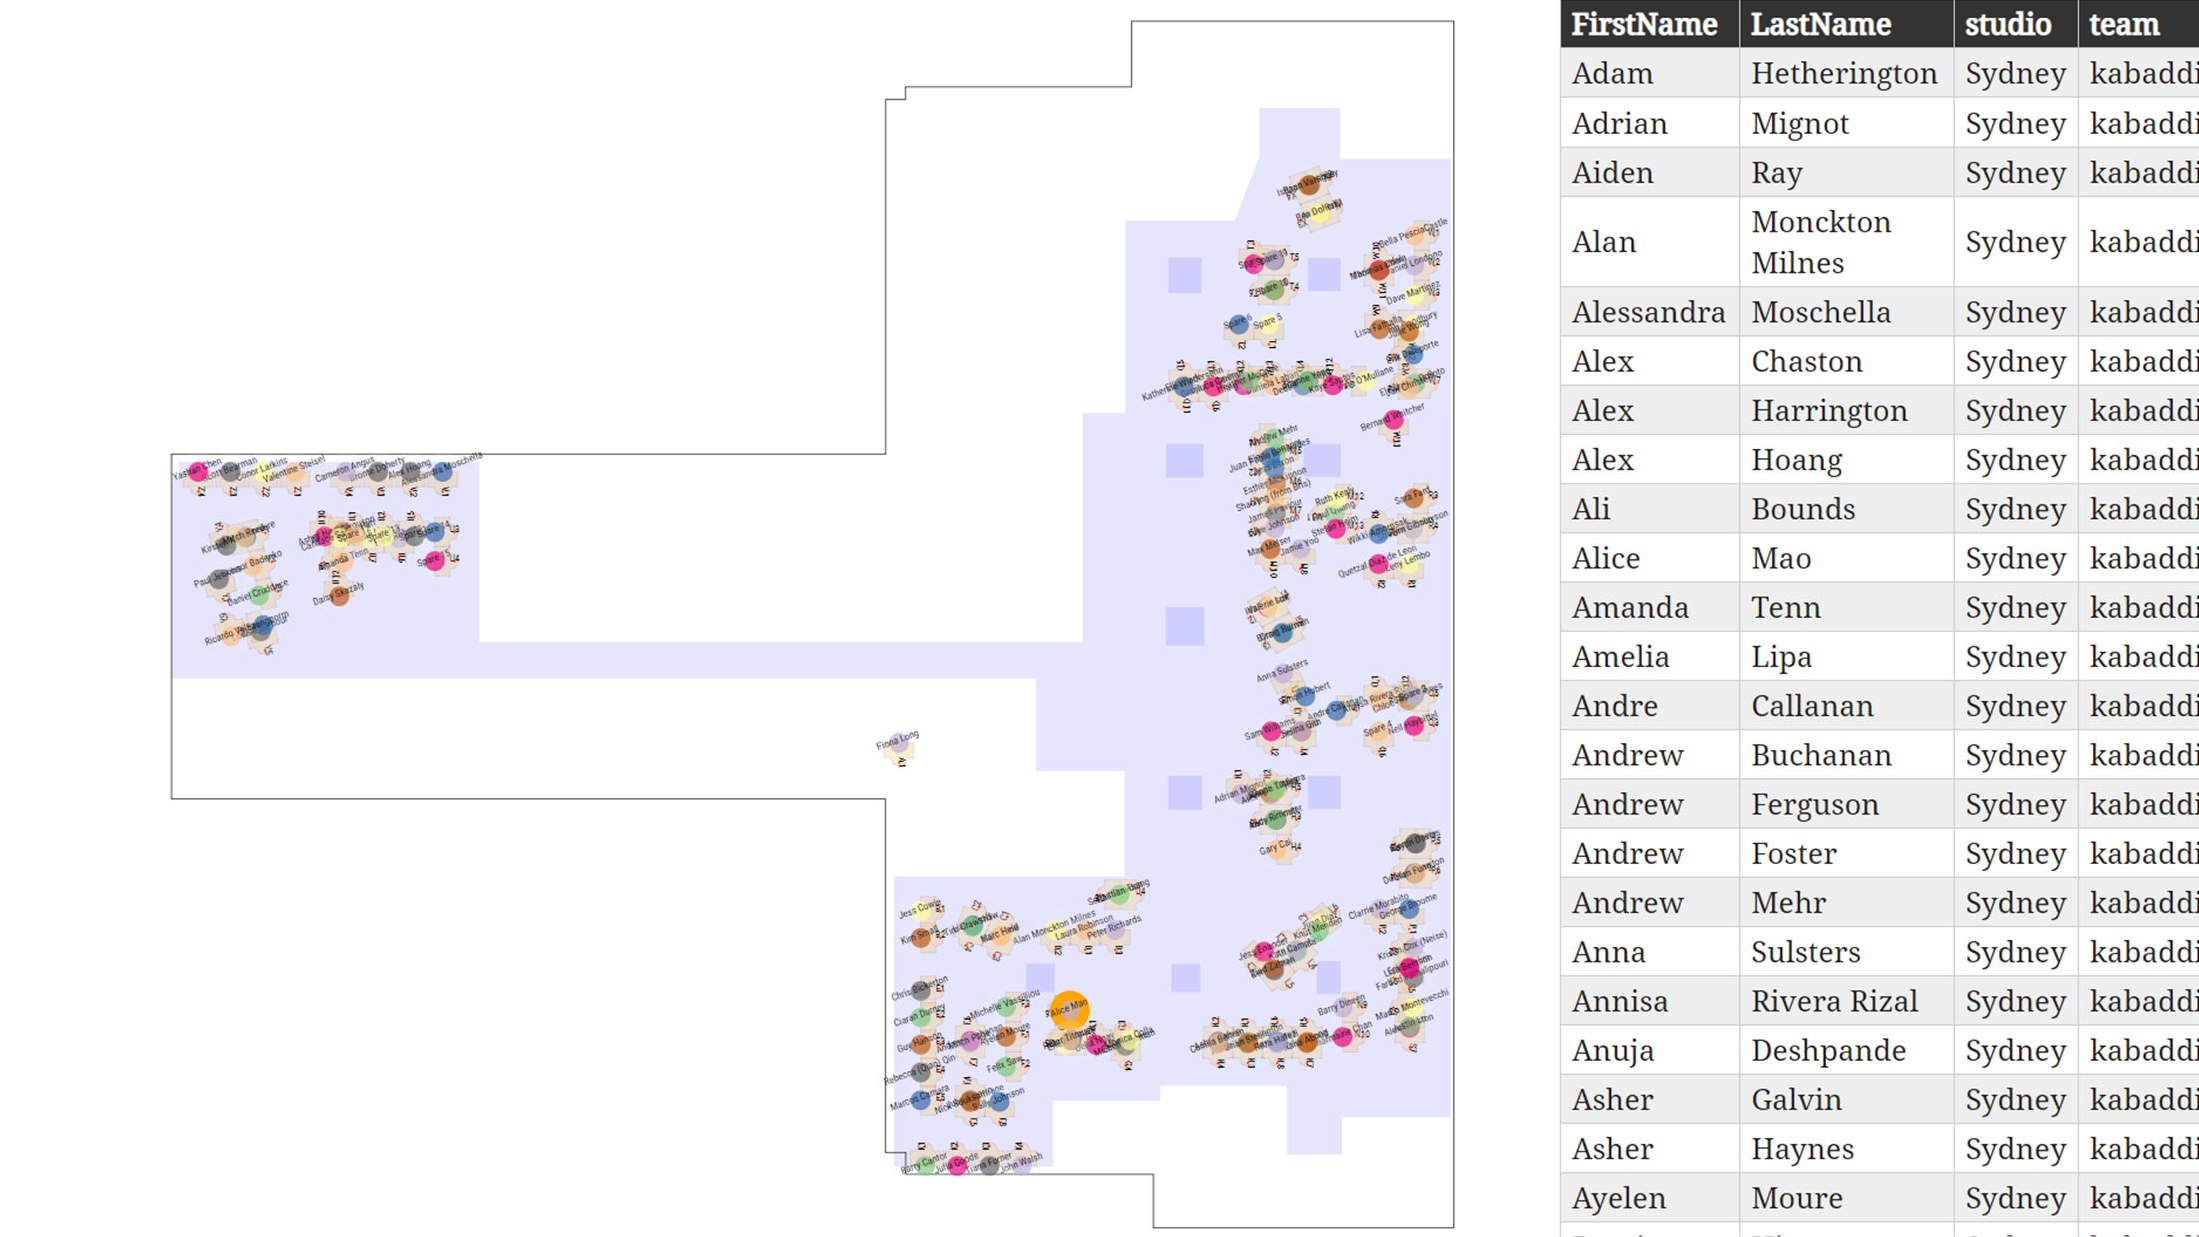
This is a semi-finished interface for interacting with the back end.
-
-
Unexpected challenges
Optimisation stuff:
Designing practical GA cost functions for a given organisational objective. Took a fair bit of experimentation and tweaking before we for the cost function for proximity that worked.
Writing cache sidecars to integrate with python libs e.g. networkx shortest_path function
Getting data out of Revit, and into a web representation is a drag. I lost an amazing amount of time to Revit reporting angles clockwise from East, rather than anti clockwise like every other graphics program that I’ve ever used.
Creating a spatial network is a pretty computationally intensive job in Grasshopper python. Given that it’s a trade off between performance and readability, it might be worth rewriting it at a lower level of abstraction.
Organisational stuff:
Getting company data is far more difficult than you might imagine. This might be just us, but I doubt it. Information about people is rarely centralised, and even more rarely consistent. Just to get team data membership I had to rebuild the planning spreadsheet to make it machine readable. Doing that for a more elaborate social network will need a much more data driven organisation.
-
-
Further work
We’d be interested to see this applied to a real workplace. How does this stand up to a real scenario? Generate more nuanced versions of the three components. This is a little tricky as the representation of the networks will influence how the objective function works. We currently use only edge weights, but adding metadata will add interesting complexity.
-
-
There’s a human/ethical component to this. Command and control works well for robots in warehouses, but the algo won’t be able to capture all of human motivation for a while!
-

-
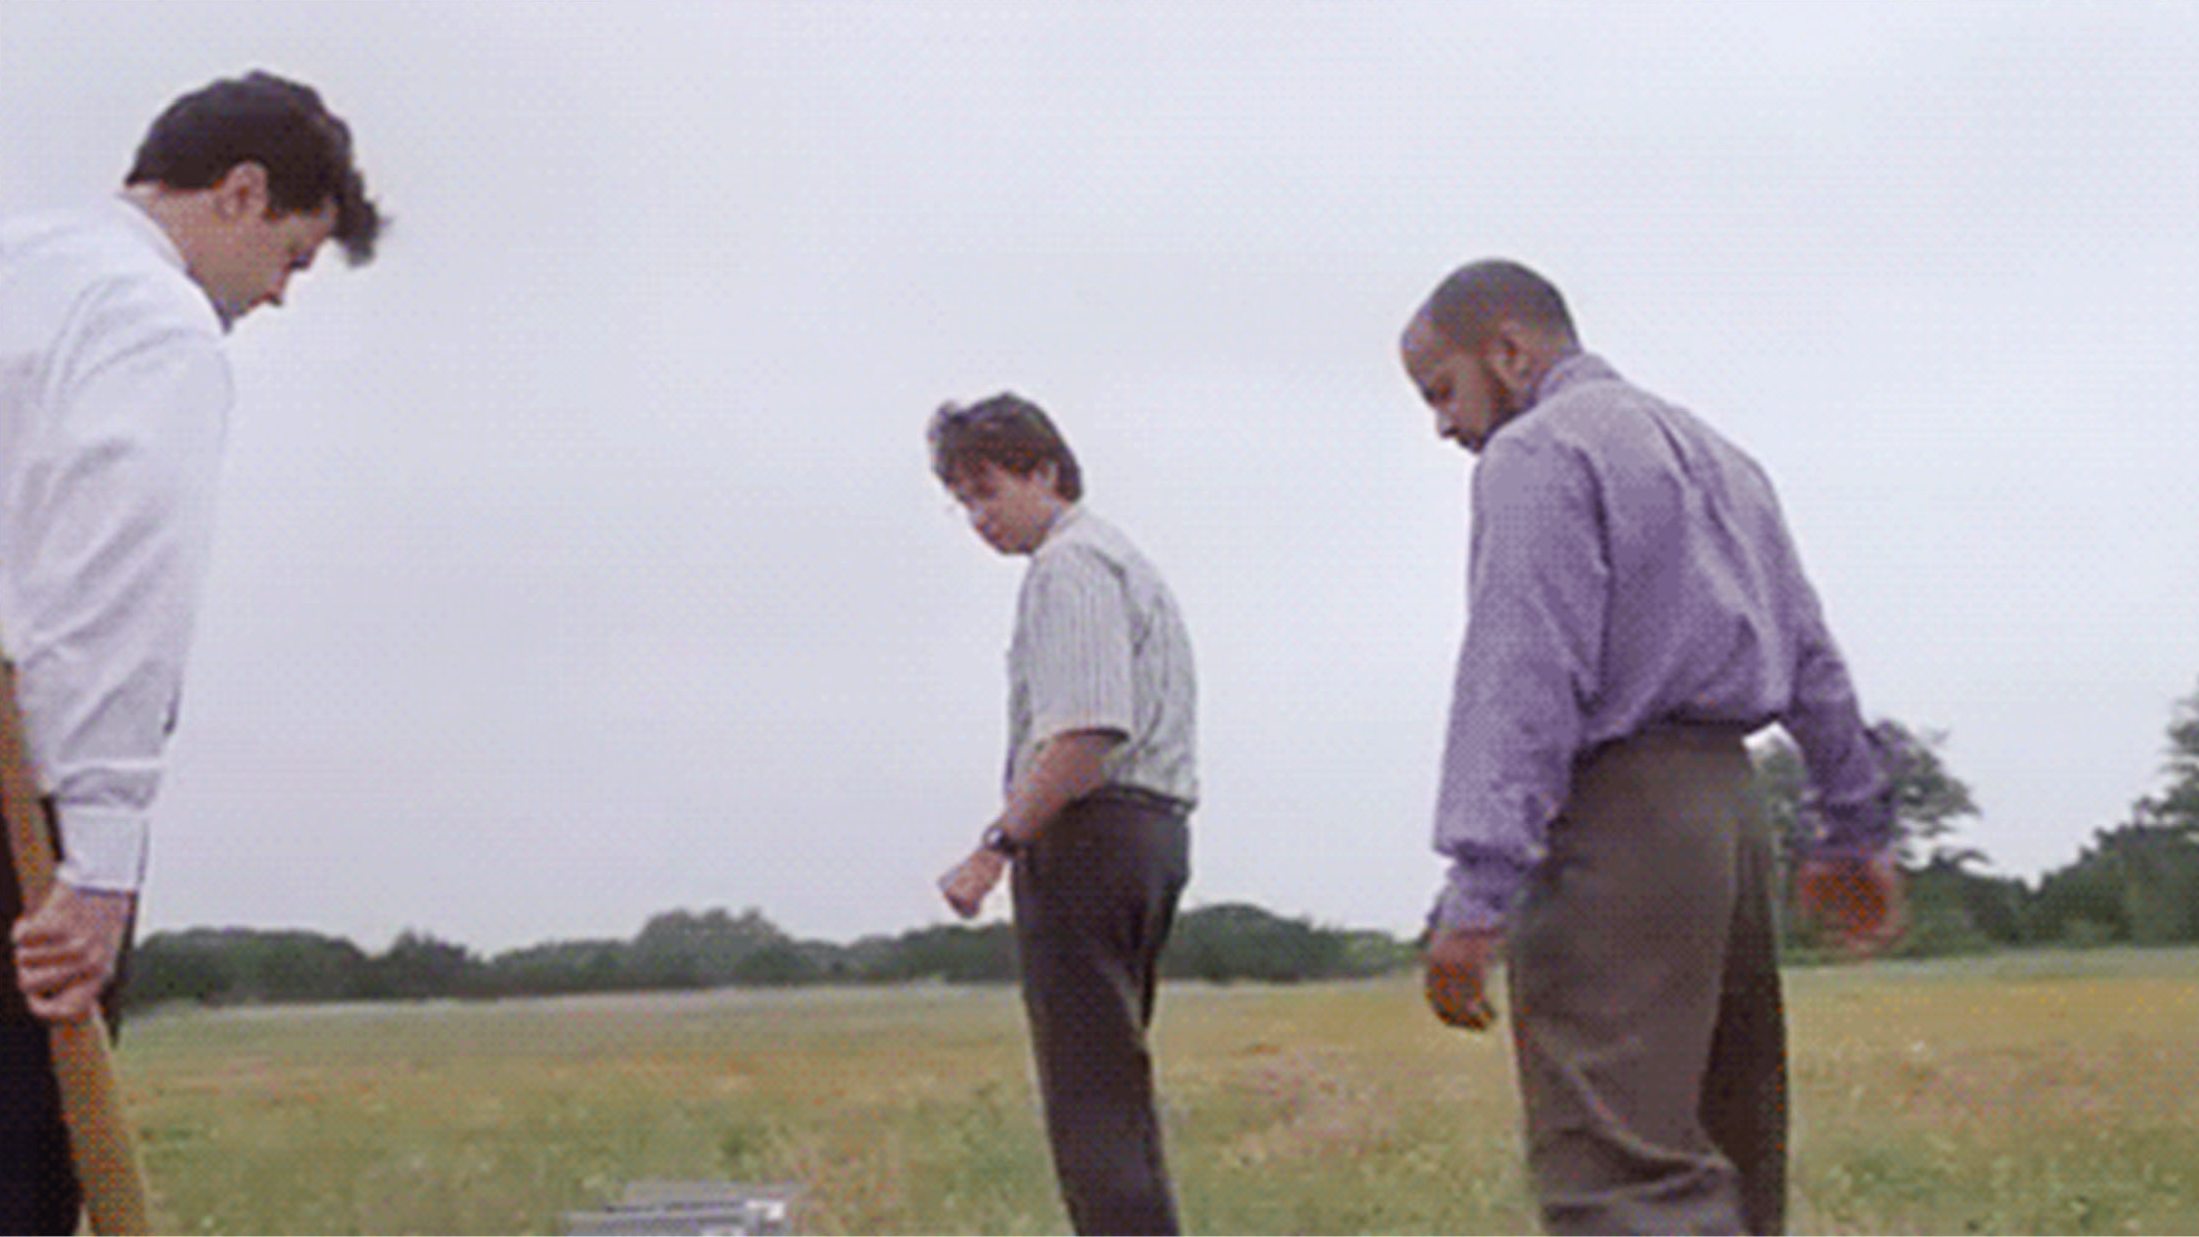
If we tell people where to go, they might tell us where to go
-
-
So, the idea is that the algo can suggest, but people, individuals, make the final call. There’s some political will involved, functional anarchism is hard work, but it might result in everyone being happier
-
-
That’s us, and that’s it!
We’re really interested in working to finish this off, especially if other people helping us/collaborating to get there!
There’s two repos:
- https://github.com/bvn-architecture/social-seating (ML, Algos)
- https://github.com/bvn-architecture/seatingPlanner (presentation)
take a look!