Gyms and pubs in Greater Sydney
A while ago I was talking with some people who lived in Auckland about how those cities perform attractiveness compared with Sydney and Vancouver. We discussed that Auckland and Vancouver are more interested in performance, and Sydney more interested in how it looks: Vancouver compares Grouse Grind times,1 Sydney compares Instagrams. I have no way of testing that, but I could look at something simpler, which is where Sydney’s gyms actually are, and how many per person there are. I also compared with where it drinks and how rich people are.
I had started on this when Milan Janosov posted a London version: 607 pubs and 134 gyms within a fifteen-minute walk of Charing Cross.2 What follows is a description of what the data shows for Greater Sydney, plot by plot. All the code and processed data are on GitHub, so anyone who wants to check a number, or argue with a category, can.
This whole post is significantly AI-ified, so when it says I, it really means that meat-I asked Claude-I to write things, and it did.
What counts
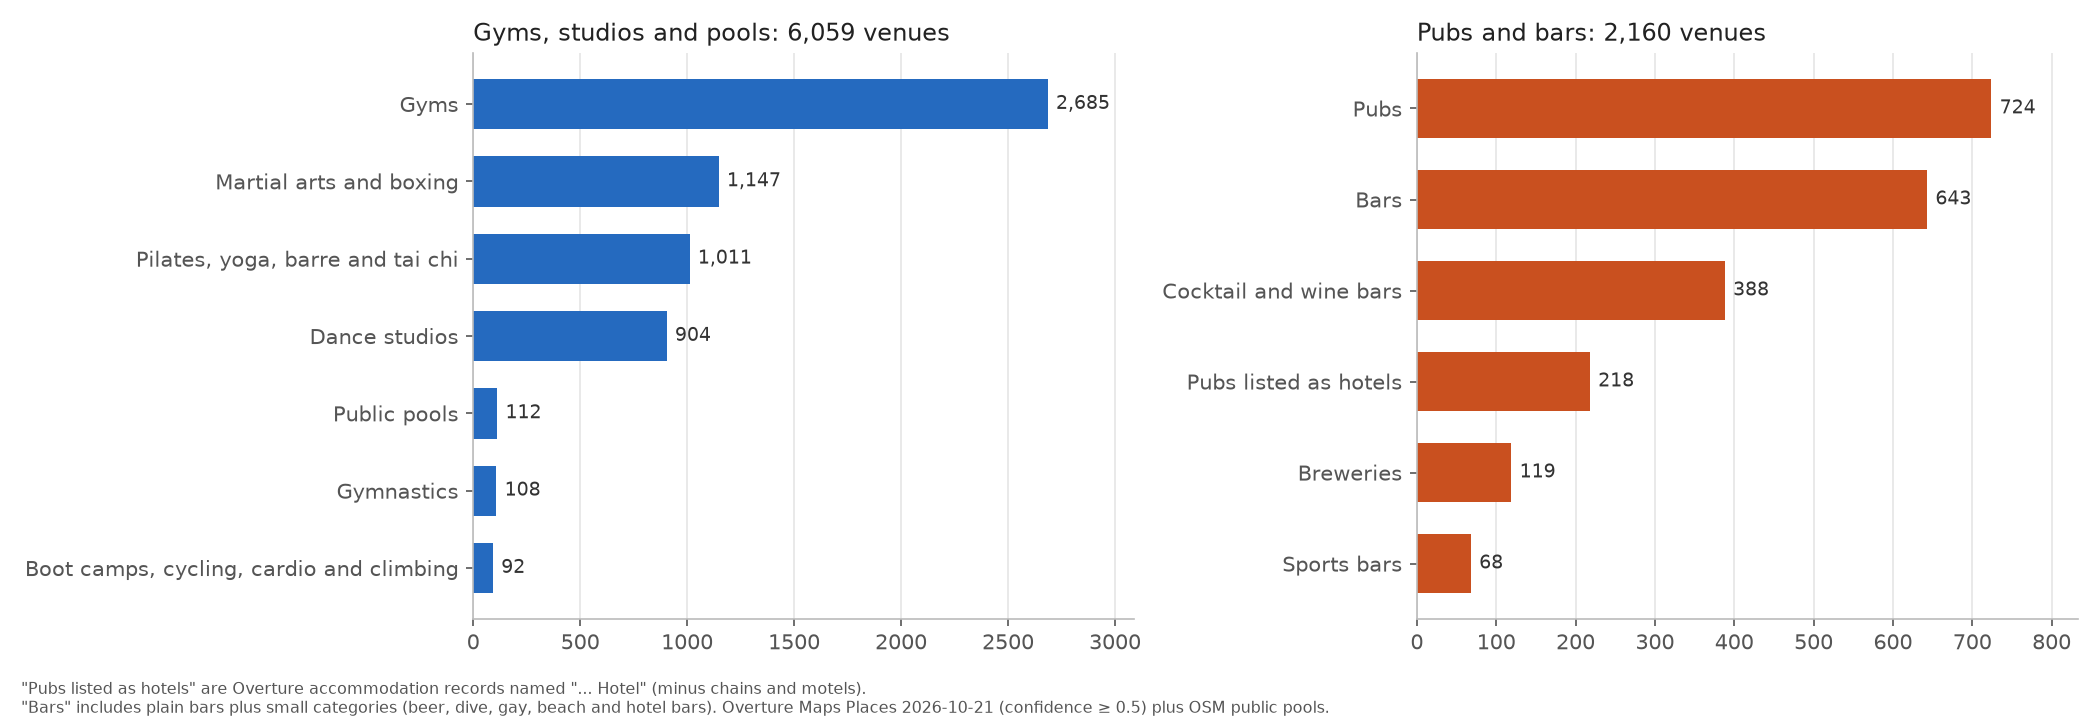
I took a broad view of what a fitness venue is and found 6,059 places: 2,685 gyms, 1,147 martial arts and boxing clubs, 1,011 pilates, yoga, barre and tai chi studios, 904 dance studios, 112 public pools, 108 gymnastics clubs, and 92 boot camps, spin studios and climbing gyms. Personal trainers and sports grounds are left out: most of the former are one person with a car, and most of the latter are ovals and golf courses.3
The 2,160 pubs and bars are: 724 pubs, 643 bars, 388 cocktail and wine bars, 119 breweries and 68 sports bars. The other 218 are pubs that the source data files as accommodation. Many Australian pubs are called ‘The Something Hotel’, and the venue database4 treats a lot of them as hotels in the sense of somewhere to sleep. I added back anything with ‘hotel’ in its name that isn’t a motel, a chain or obviously accommodation.5
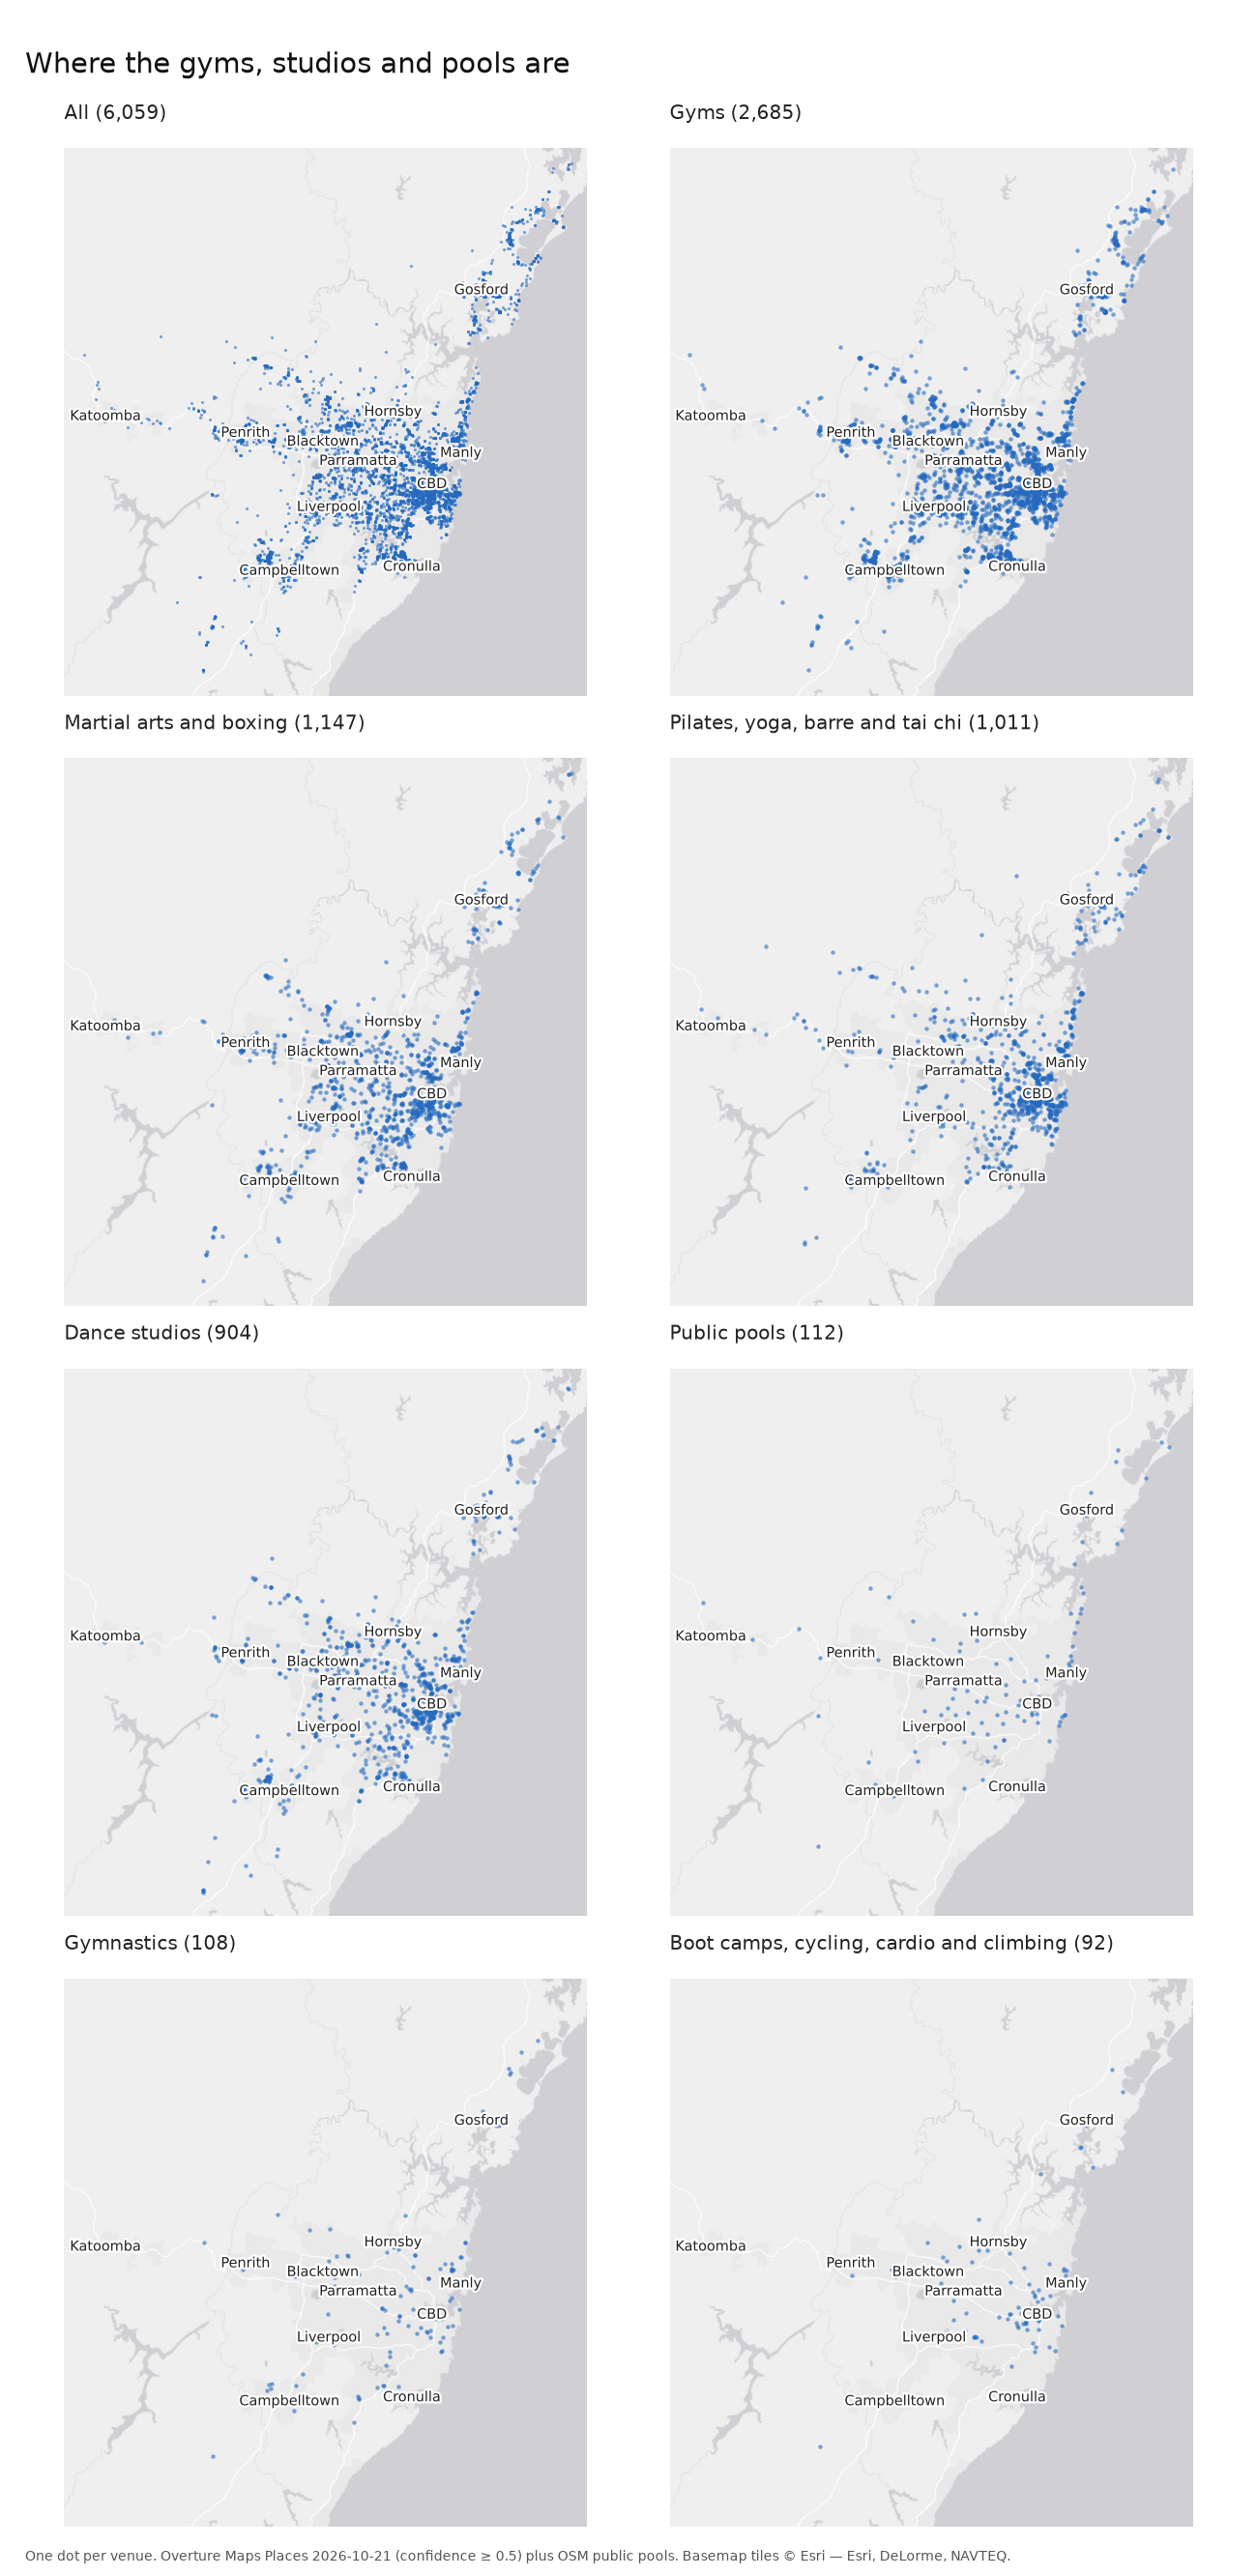
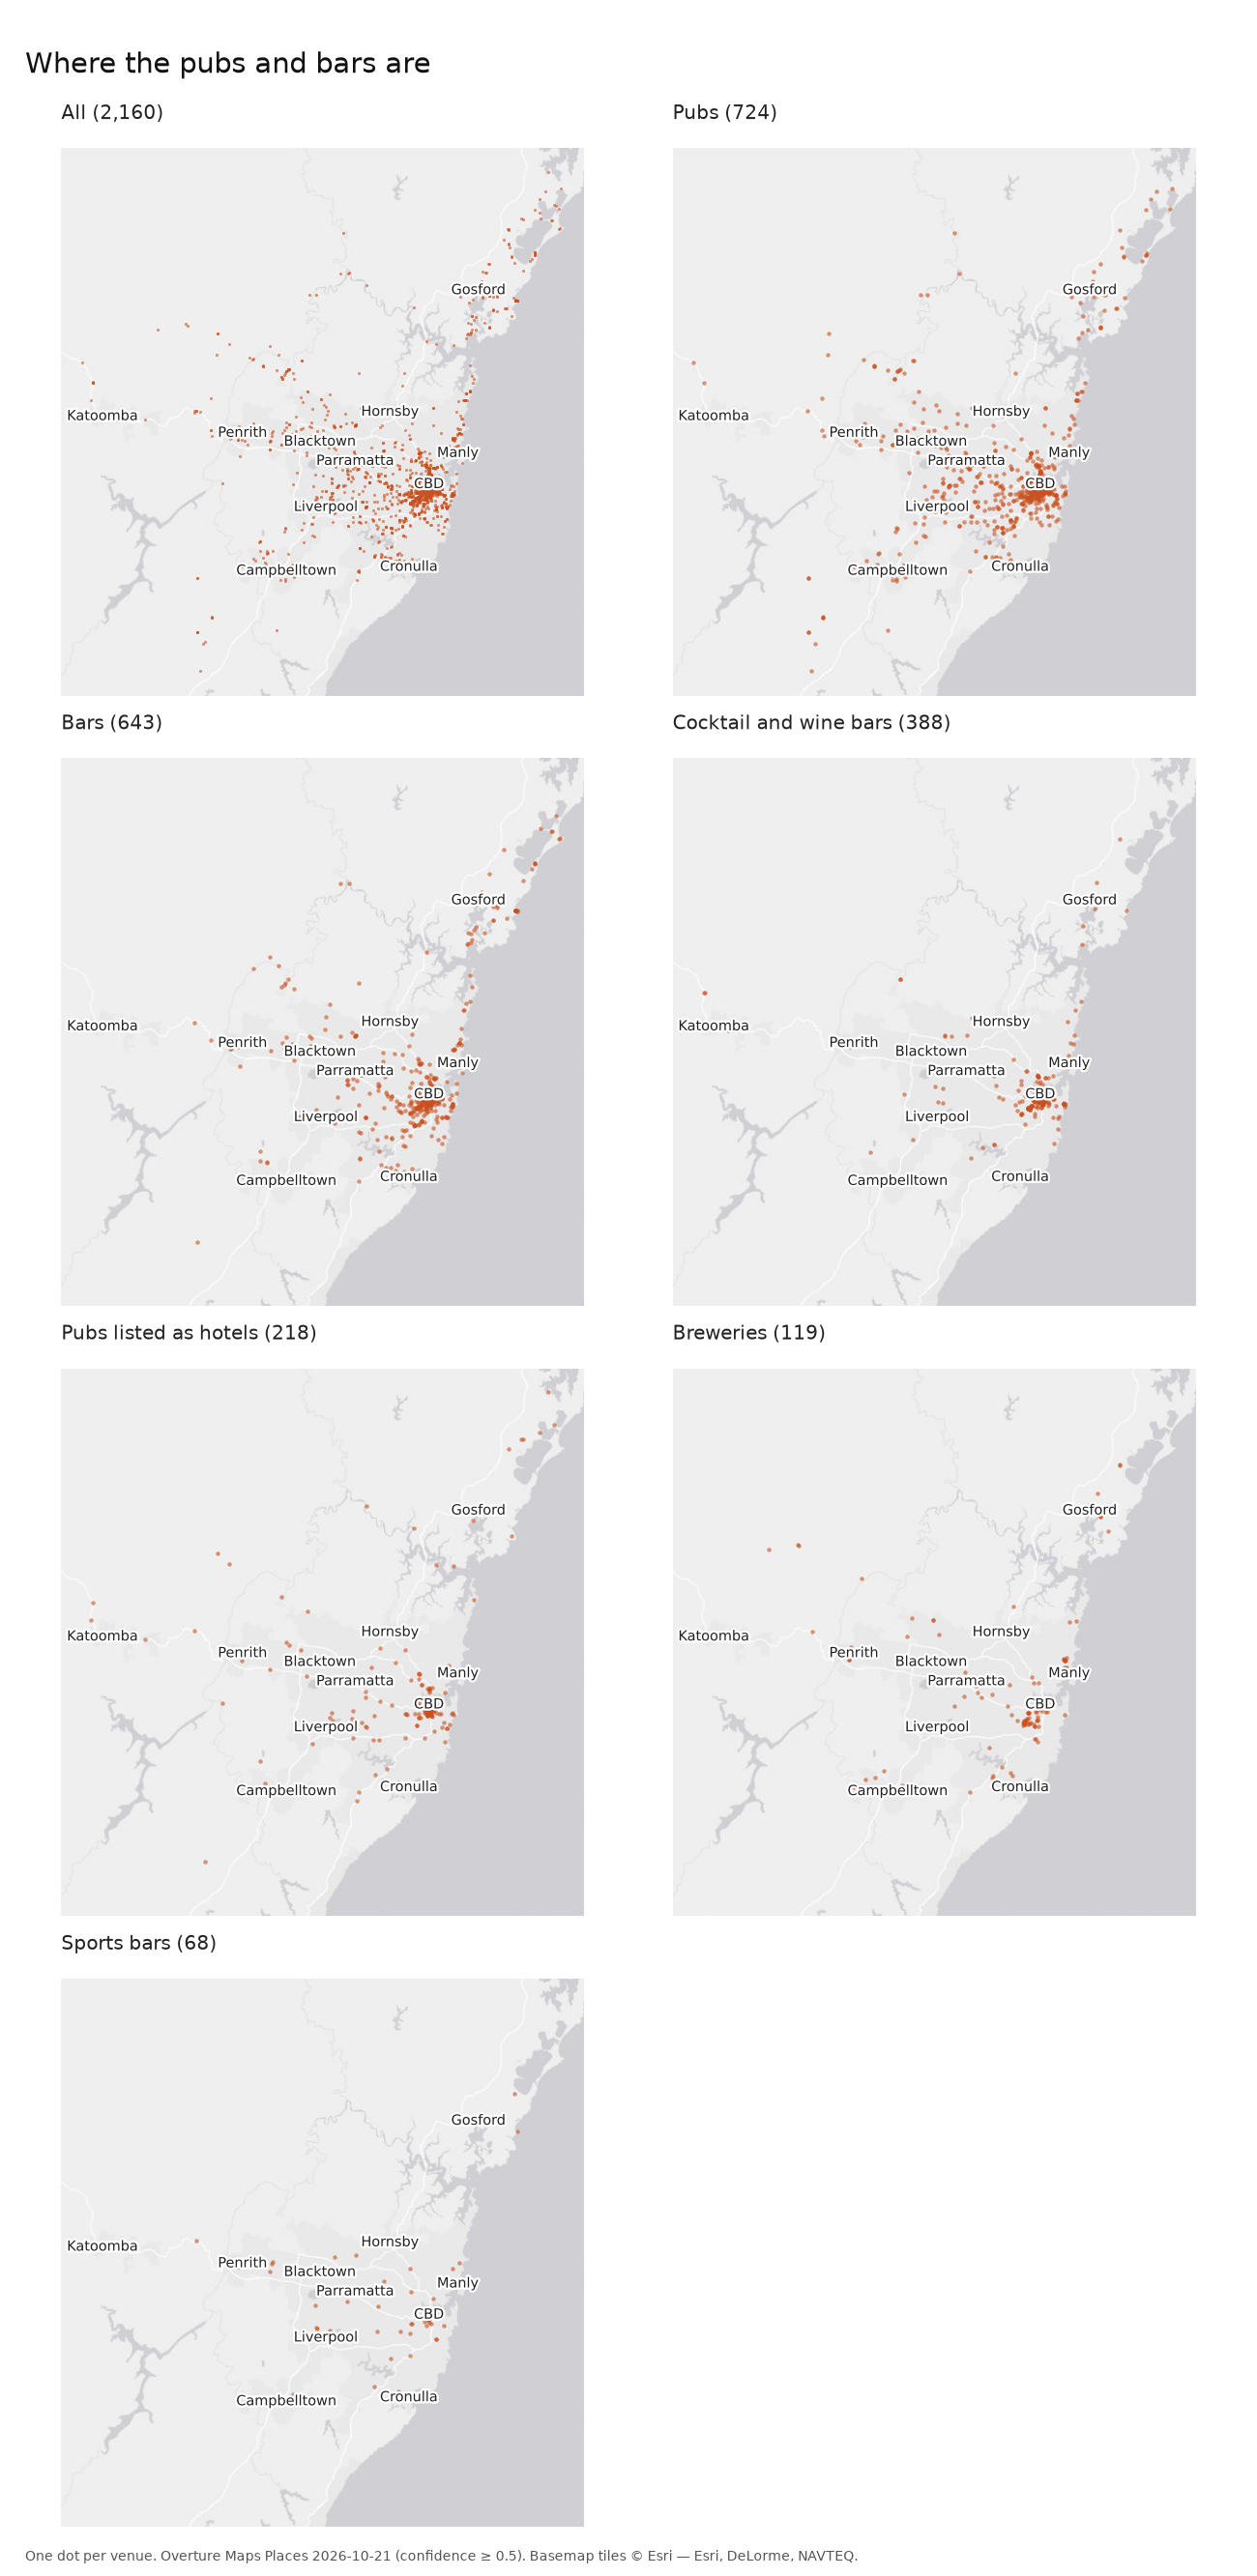
Split by type, the dots show the first pattern. Gyms, martial arts clubs and studios spread across the whole suburban area, roughly following the people. Pubs spread too, if more thinly, but cocktail bars, wine bars and breweries sit almost entirely in the inner city and inner west.
Counts and residents
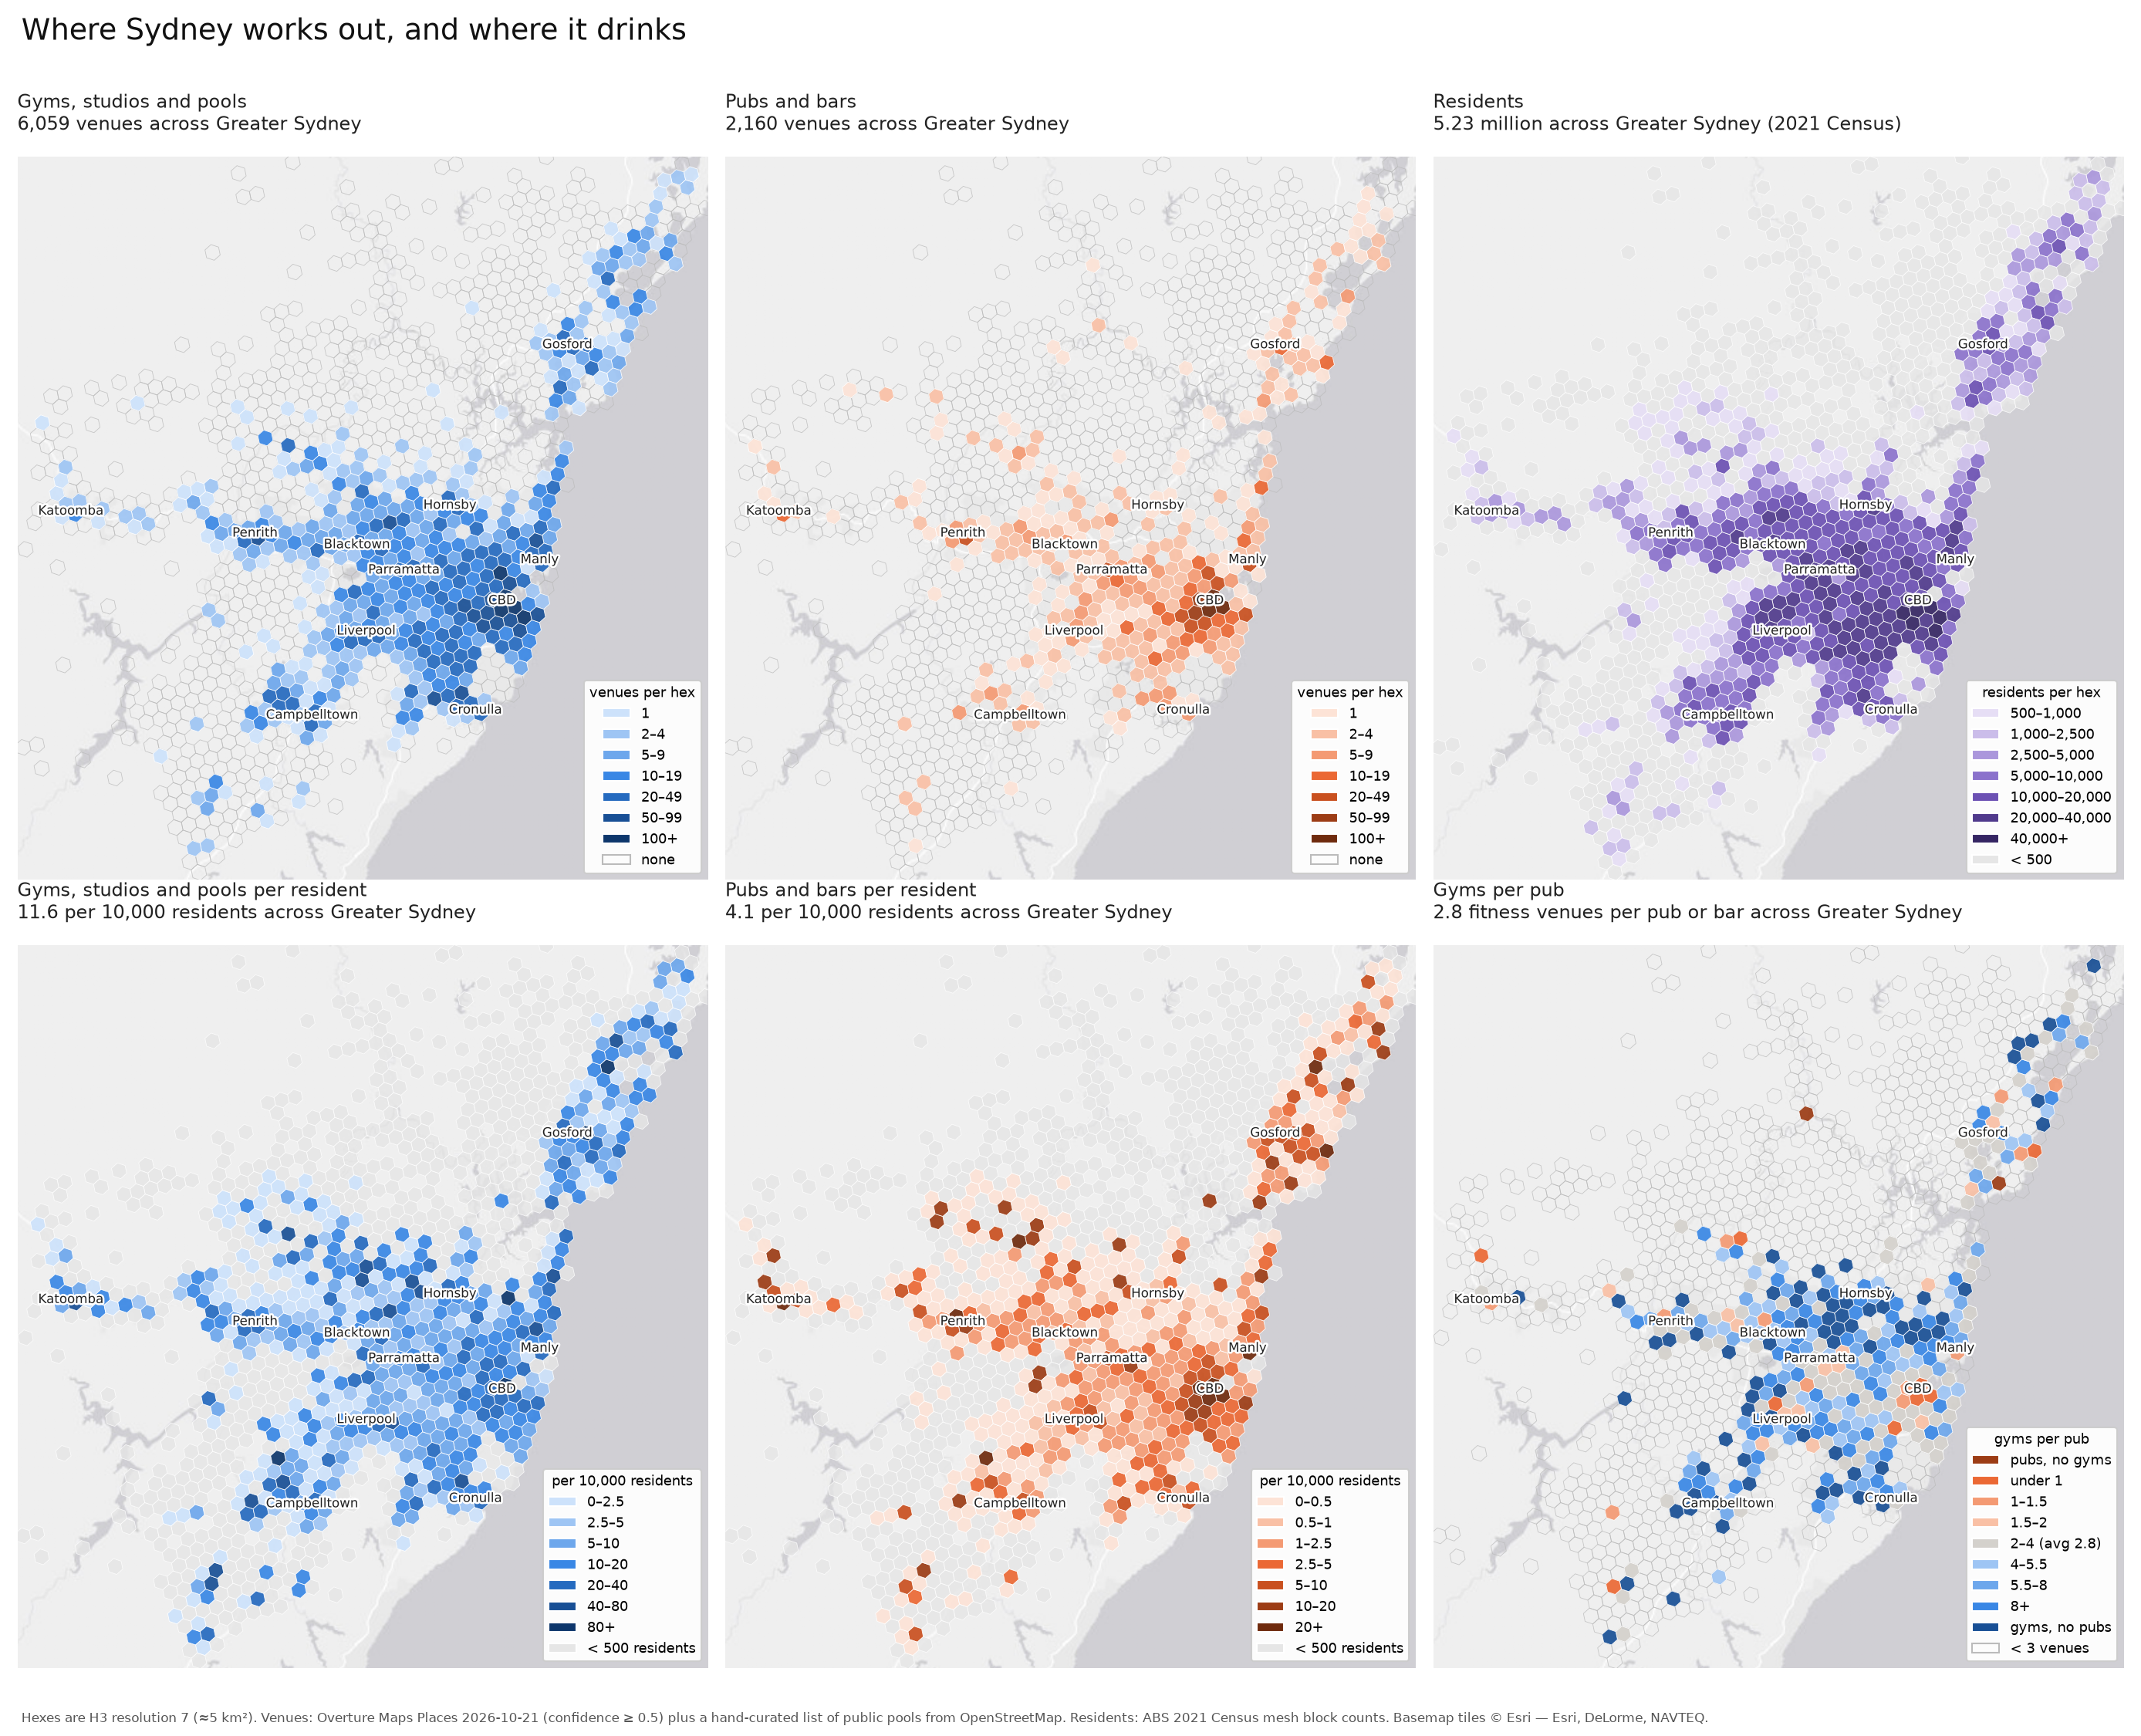
To compare places, I divided the city into hexagons of about 5 km² each6 and counted venues and residents in each one. The top row of the figure shows the raw counts. Venues of both kinds bunch in the city centre, and so, to a lesser degree, do residents. The single hex covering the CBD holds 120 fitness venues and 289 pubs and bars.
The bottom row divides by residents.7 Across Greater Sydney there are 11.6 fitness venues and 4.1 pubs and bars for every 10,000 residents, or 2.8 fitness venues for every pub. Fitness per resident is highest in the eastern suburbs, the lower north shore and the inner city. Pubs per resident are highest in the CBD and fall away quickly from it. Of the hexes with at least 500 residents, 265 contain no pub or bar at all; a fifth of Sydney’s residents live in one. Only 4% live in a hex with no fitness venue.
Daytime population
The CBD’s pubs are not really there for the 12,500 people who live in that hex. On a weekday about 317,000 people are there, most of them at work. Using Transport for NSW’s estimates of jobs by location, I worked out a weekday daytime population for every part of the city: residents, minus those who leave for work, plus those who arrive.8
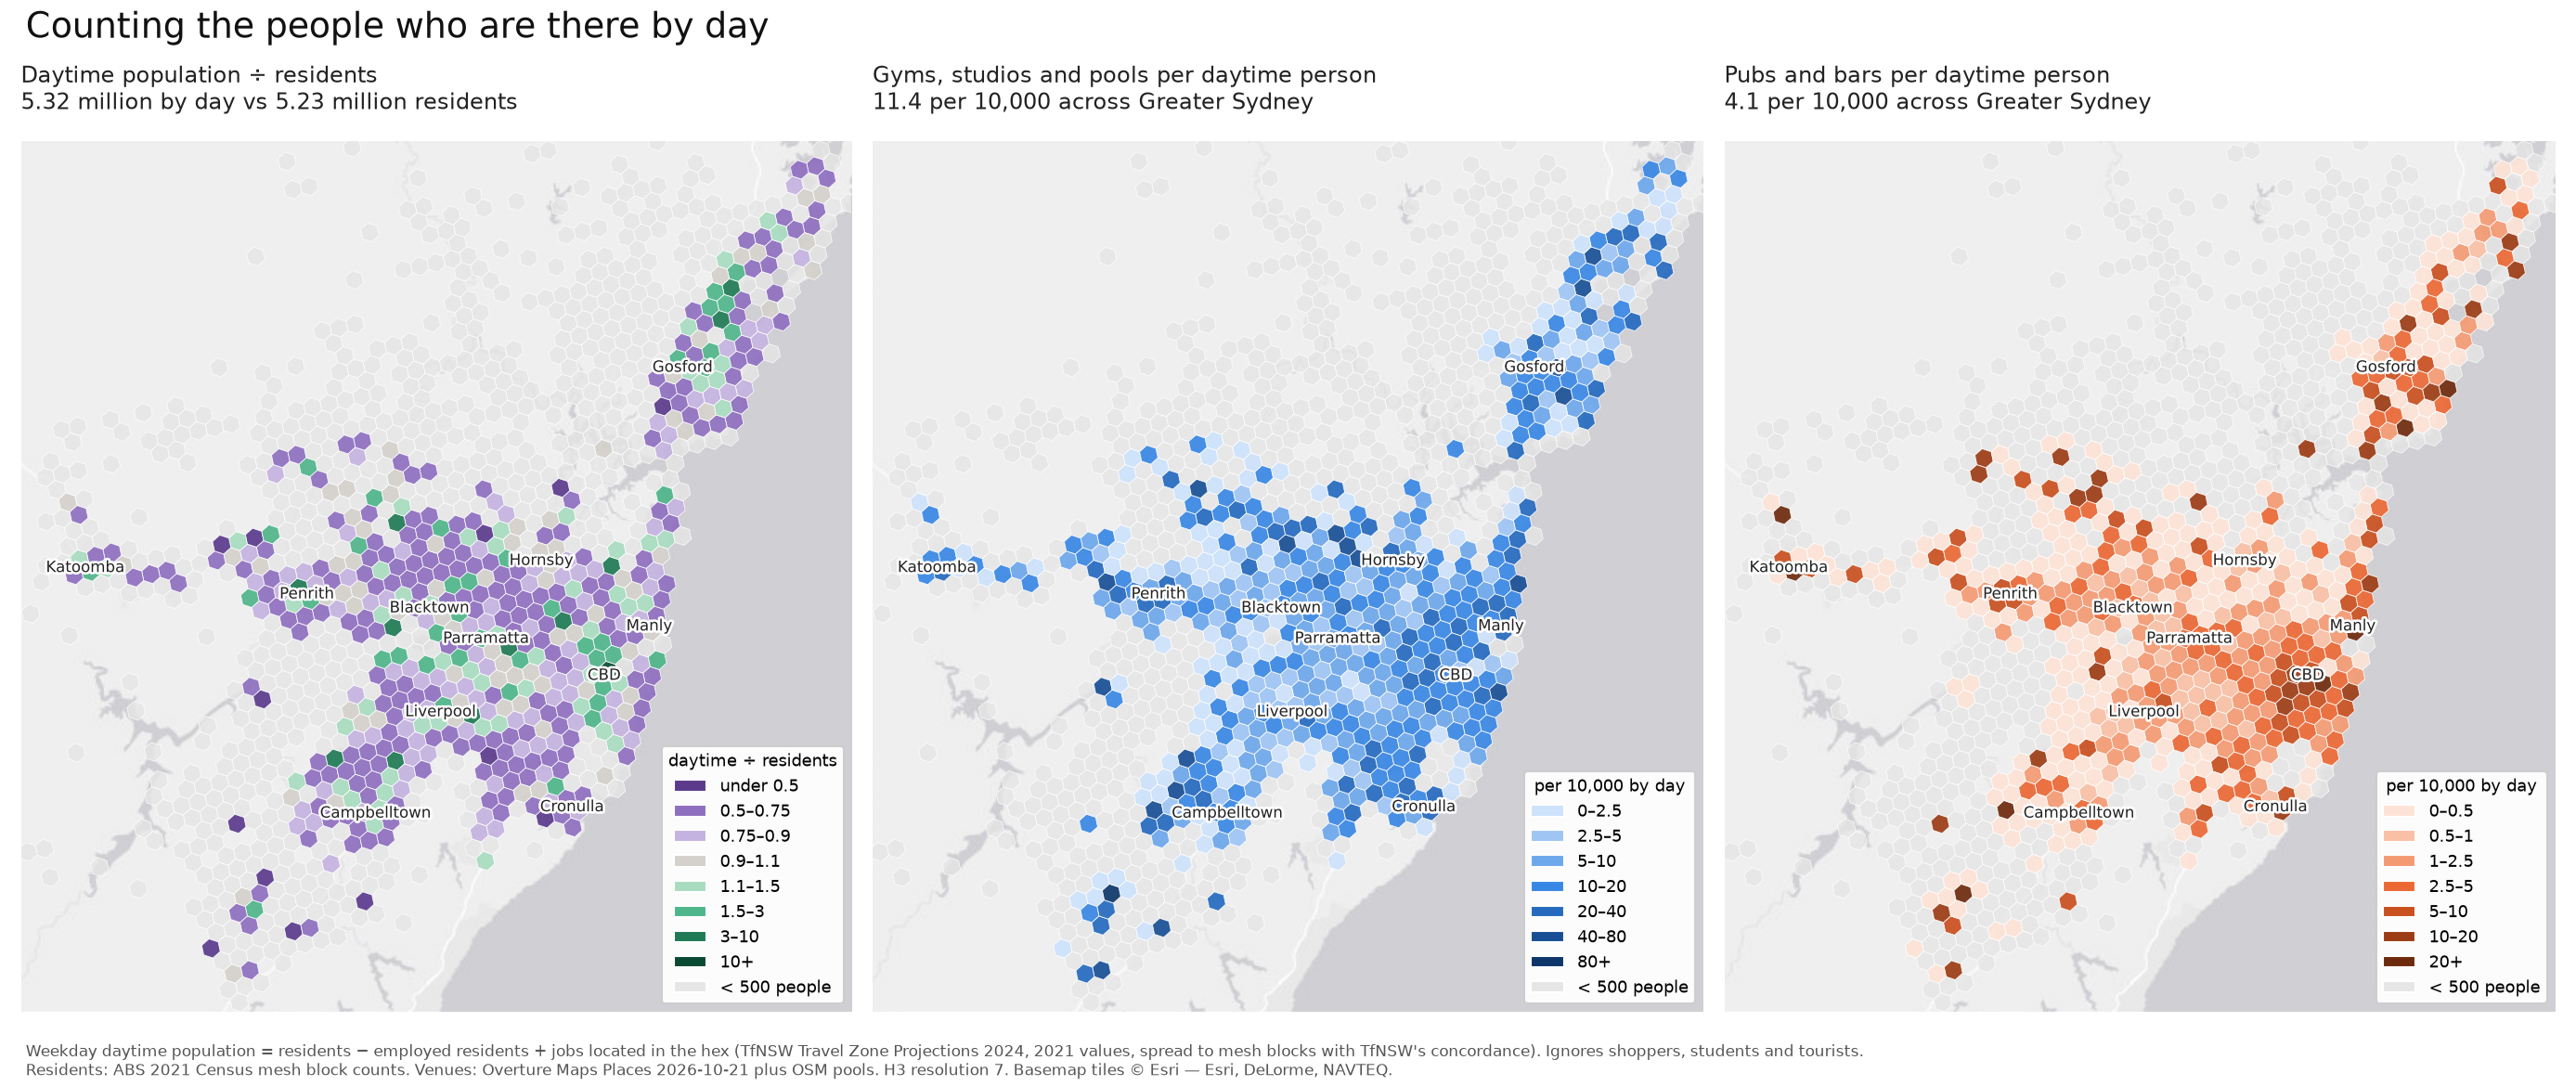
The left panel shows where Sydney goes by day: the job centres, led by the CBD, gain people, and most residential suburbs lose some. Measured per daytime person, rates in the inner city roughly halve, and pubs fall from 20–40 per 10,000 to 10–17. The middle and outer suburbs barely change, because they don’t gain or lose many people overall.
So commuters account for about half of the inner city’s apparent surplus of pubs and gyms. The other half is still there: per daytime person, the inner ring has three to five times as many pubs as outer Sydney.
Gyms per pub
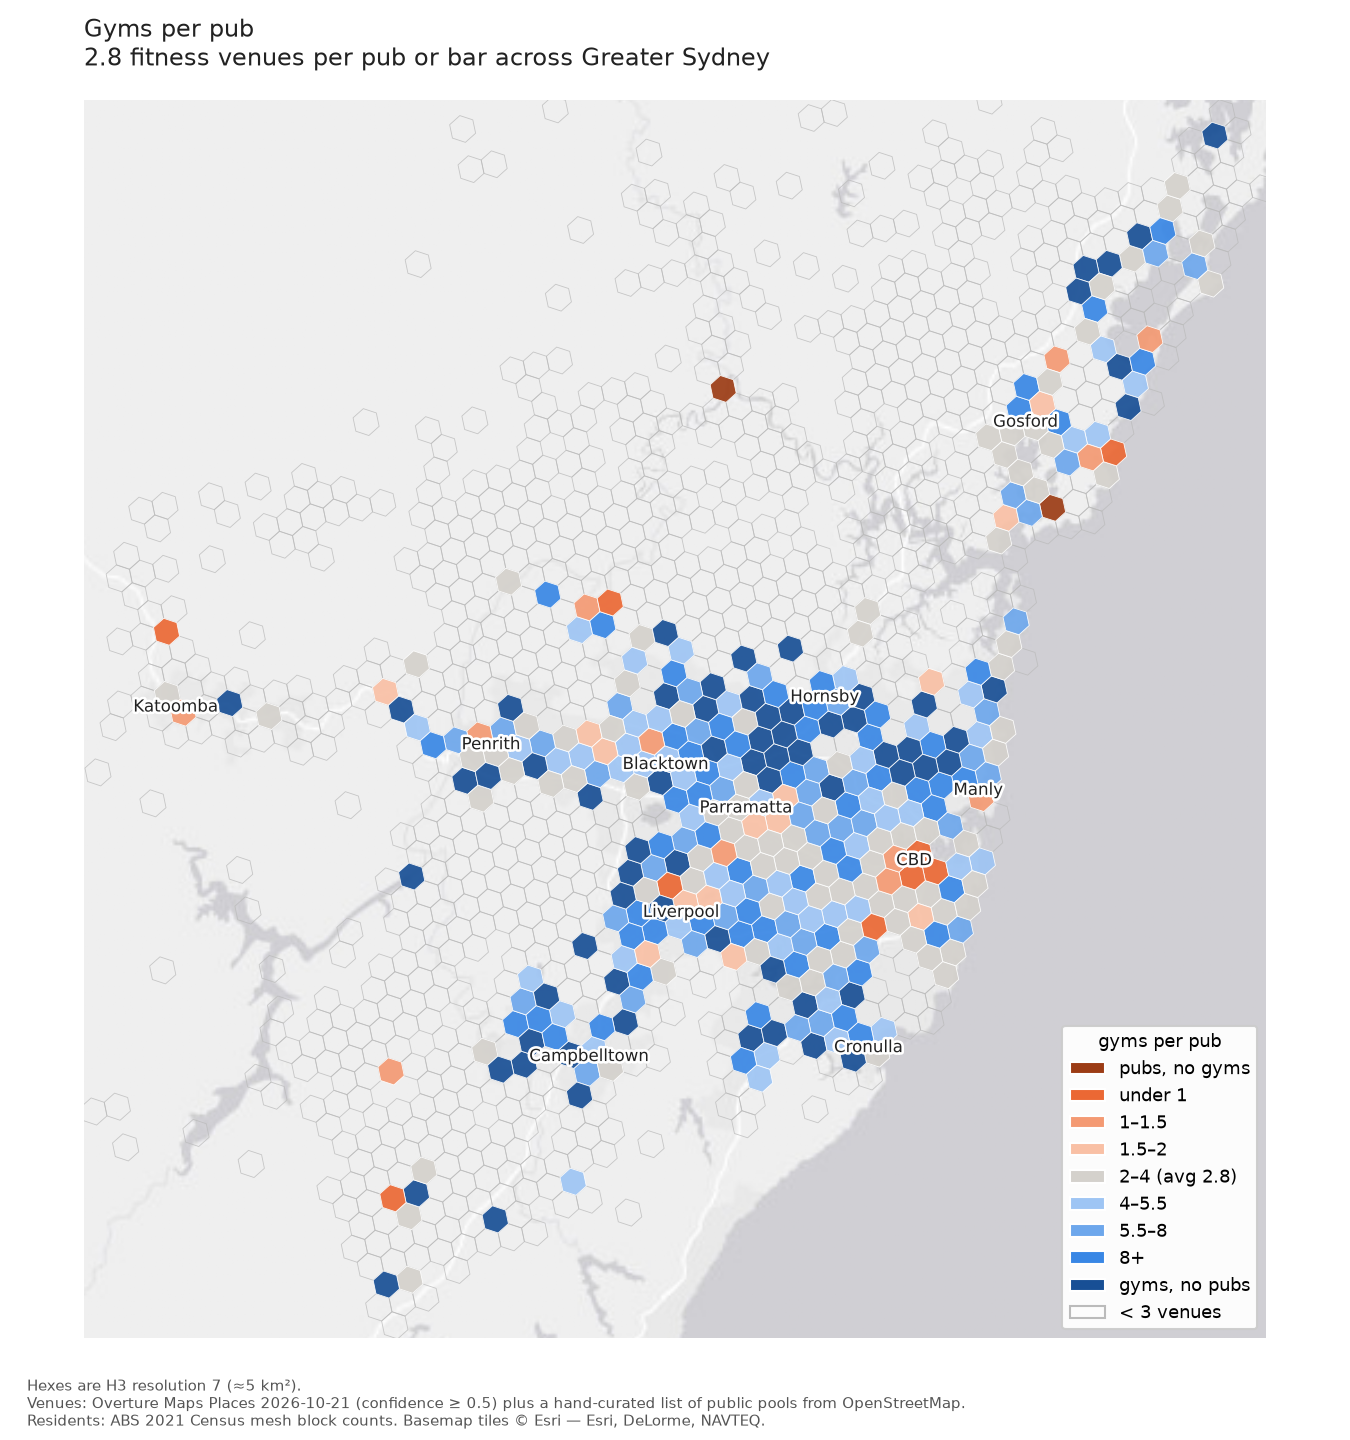
Putting the two counts together gives a ratio that doesn’t depend on population at all. The map is centred on the Sydney figure of 2.8, so grey hexes are about average, orange ones lean towards pubs and blue ones towards gyms. The CBD and the inner ring are orange. The Hills district, the upper north shore and the growth areas in the south-west are deep blue, and many hexes there have gyms and no pubs at all.
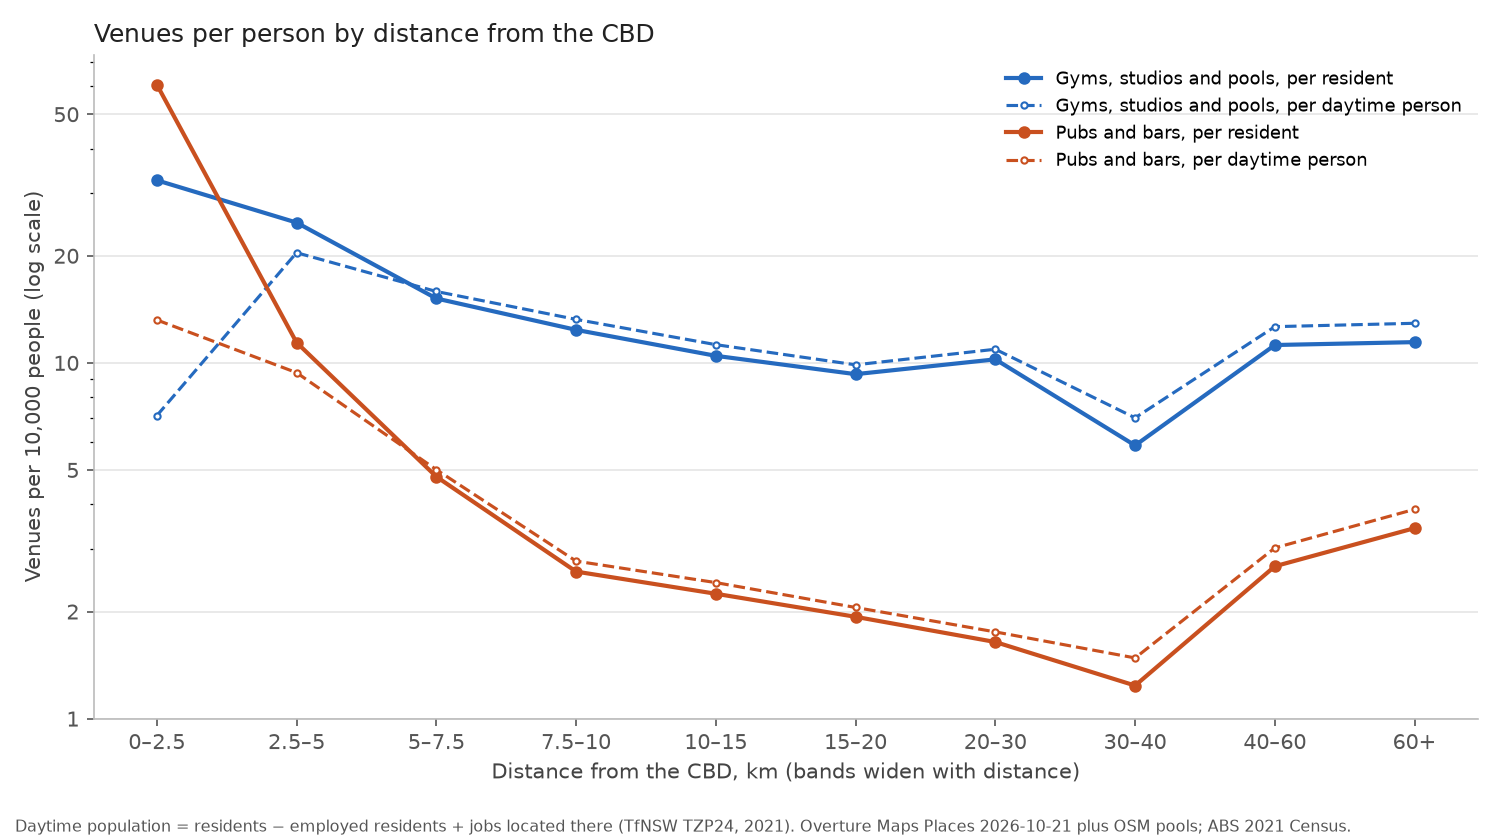
The same pattern by distance from the CBD: within 2.5 km there are 61 pubs and bars per 10,000 residents and 33 fitness venues. By 10–15 km that is down to 2.2 pubs and 10.5 fitness venues. Pubs keep falling with distance, while fitness levels off at around 10 per 10,000 from about 10 km out. The rise at 40 km and beyond comes from the Central Coast, the Blue Mountains and the semi-rural fringe, where a few venues serve small, spread-out populations. The dashed lines are per daytime person, and they show the same shape with a lower peak.
Advantage
Someone once said that every map is a map of wealth, and I wanted to see how much of this one is. The measure I used is the ABS Index of Relative Socio-economic Advantage and Disadvantage (IRSAD), which combines income, education, occupation and housing.9 It is published for small areas of a few hundred people, so I averaged it into the hexes weighted by population, and ranked all of Greater Sydney into ten groups of equal population.
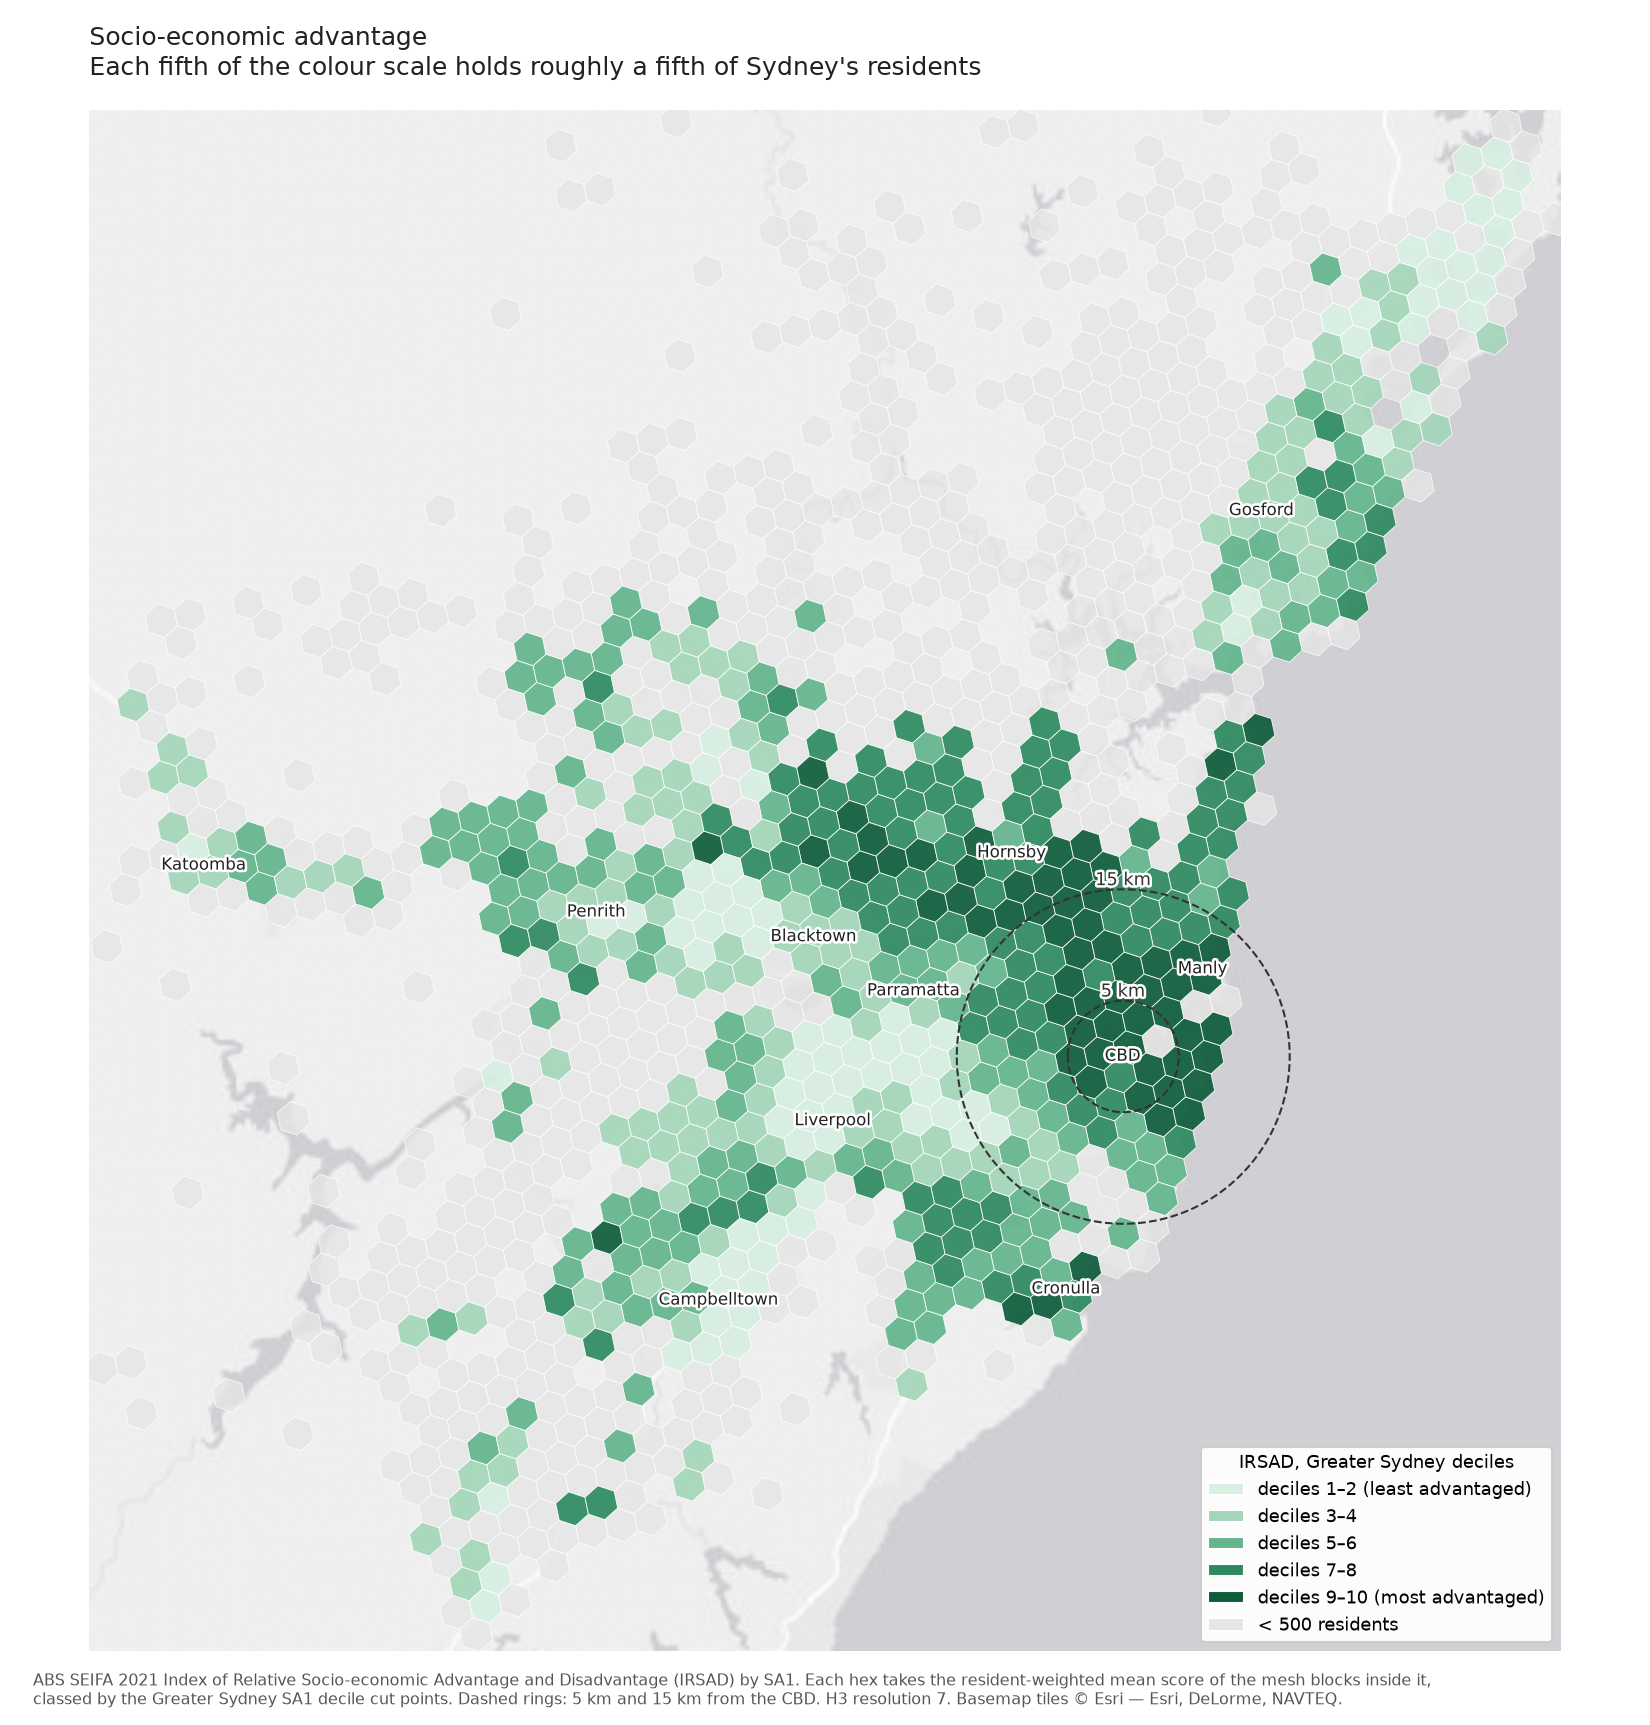
The familiar geography appears: the most advantaged areas run along the harbour, the eastern suburbs and the north shore, out to the Hills and down to the Sutherland Shire; the least advantaged cover much of the west and south-west.
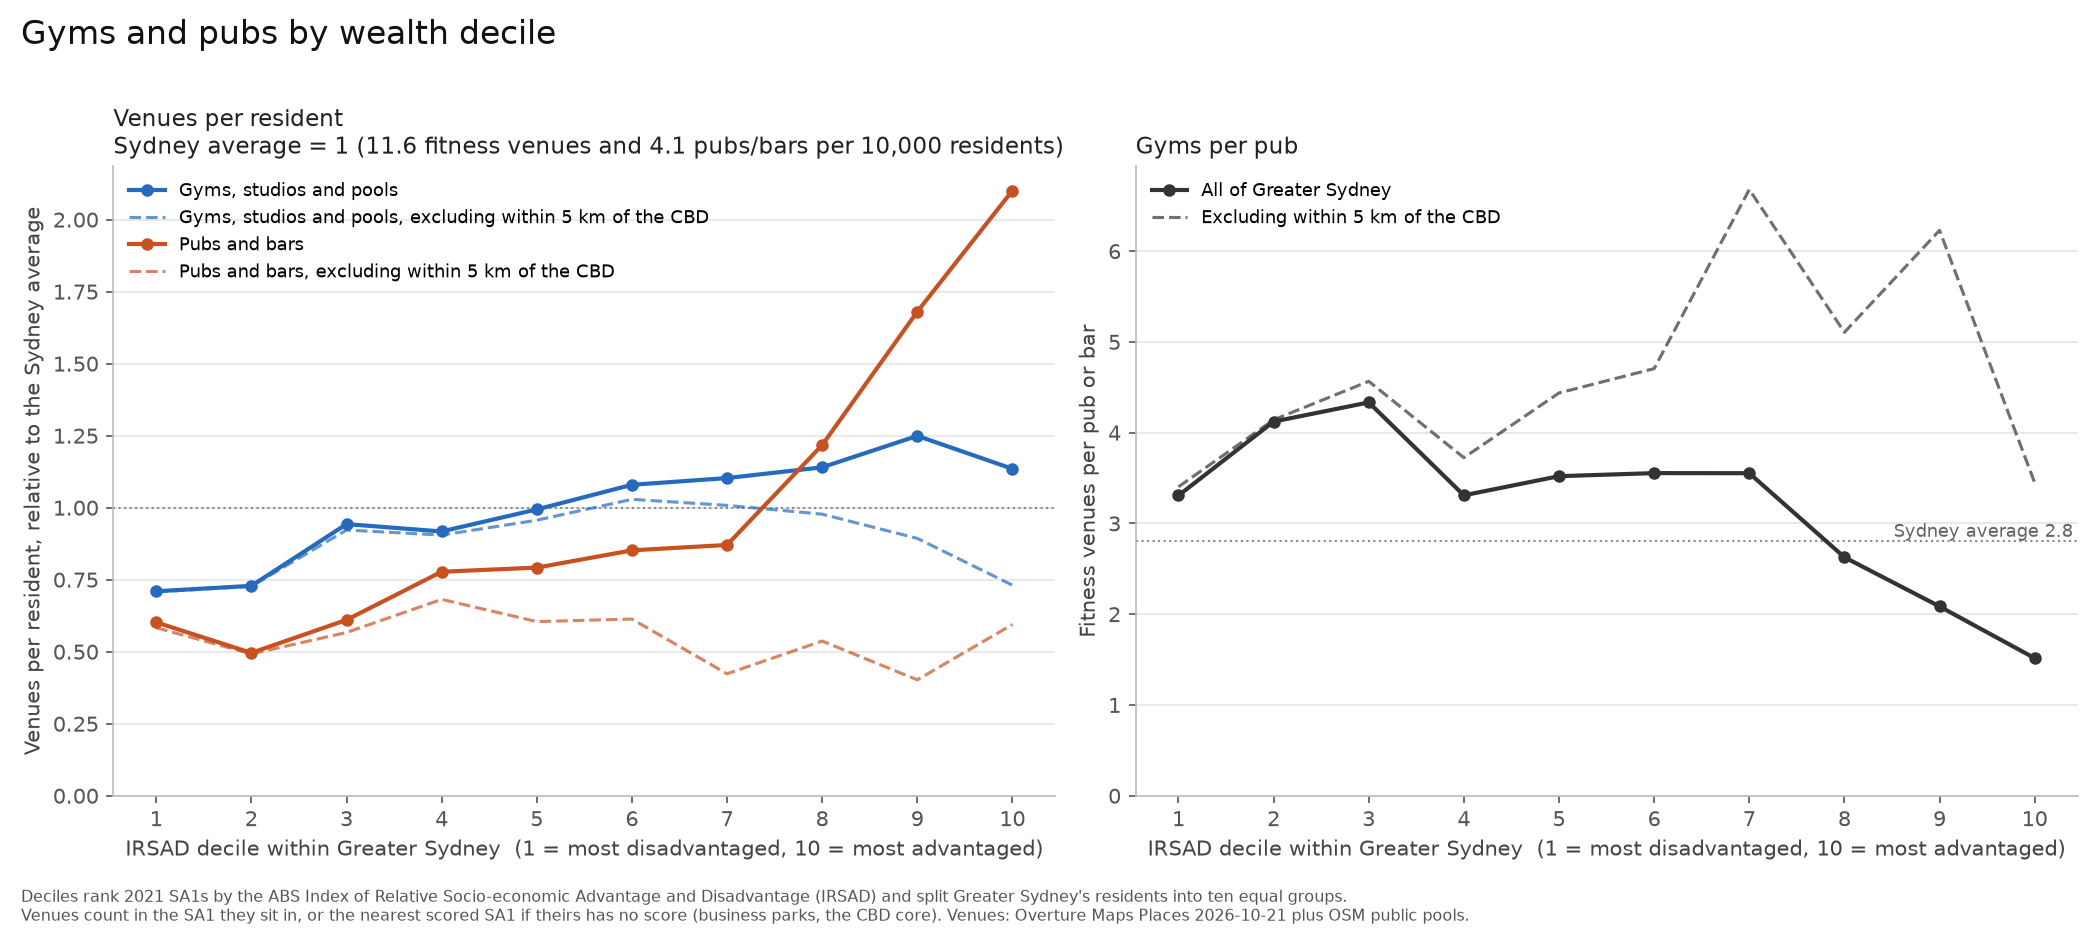
Across the whole city, both lines rise with advantage. Fitness venues go from 8.3 per 10,000 residents in the least advantaged decile to 13–14.5 in the top three, and pubs from 2.5 to 8.7, so the richest tenth has the fewest gyms per pub. Much of that is the inner city, which is both rich and full of venues. Leaving out everything within 5 km of the CBD takes most of the pubs with it: outside that radius, pubs per resident stay between 1.7 and 2.8 at every decile, and fitness rises to about 12 in the middle deciles before falling back to 8.5 in the top one.
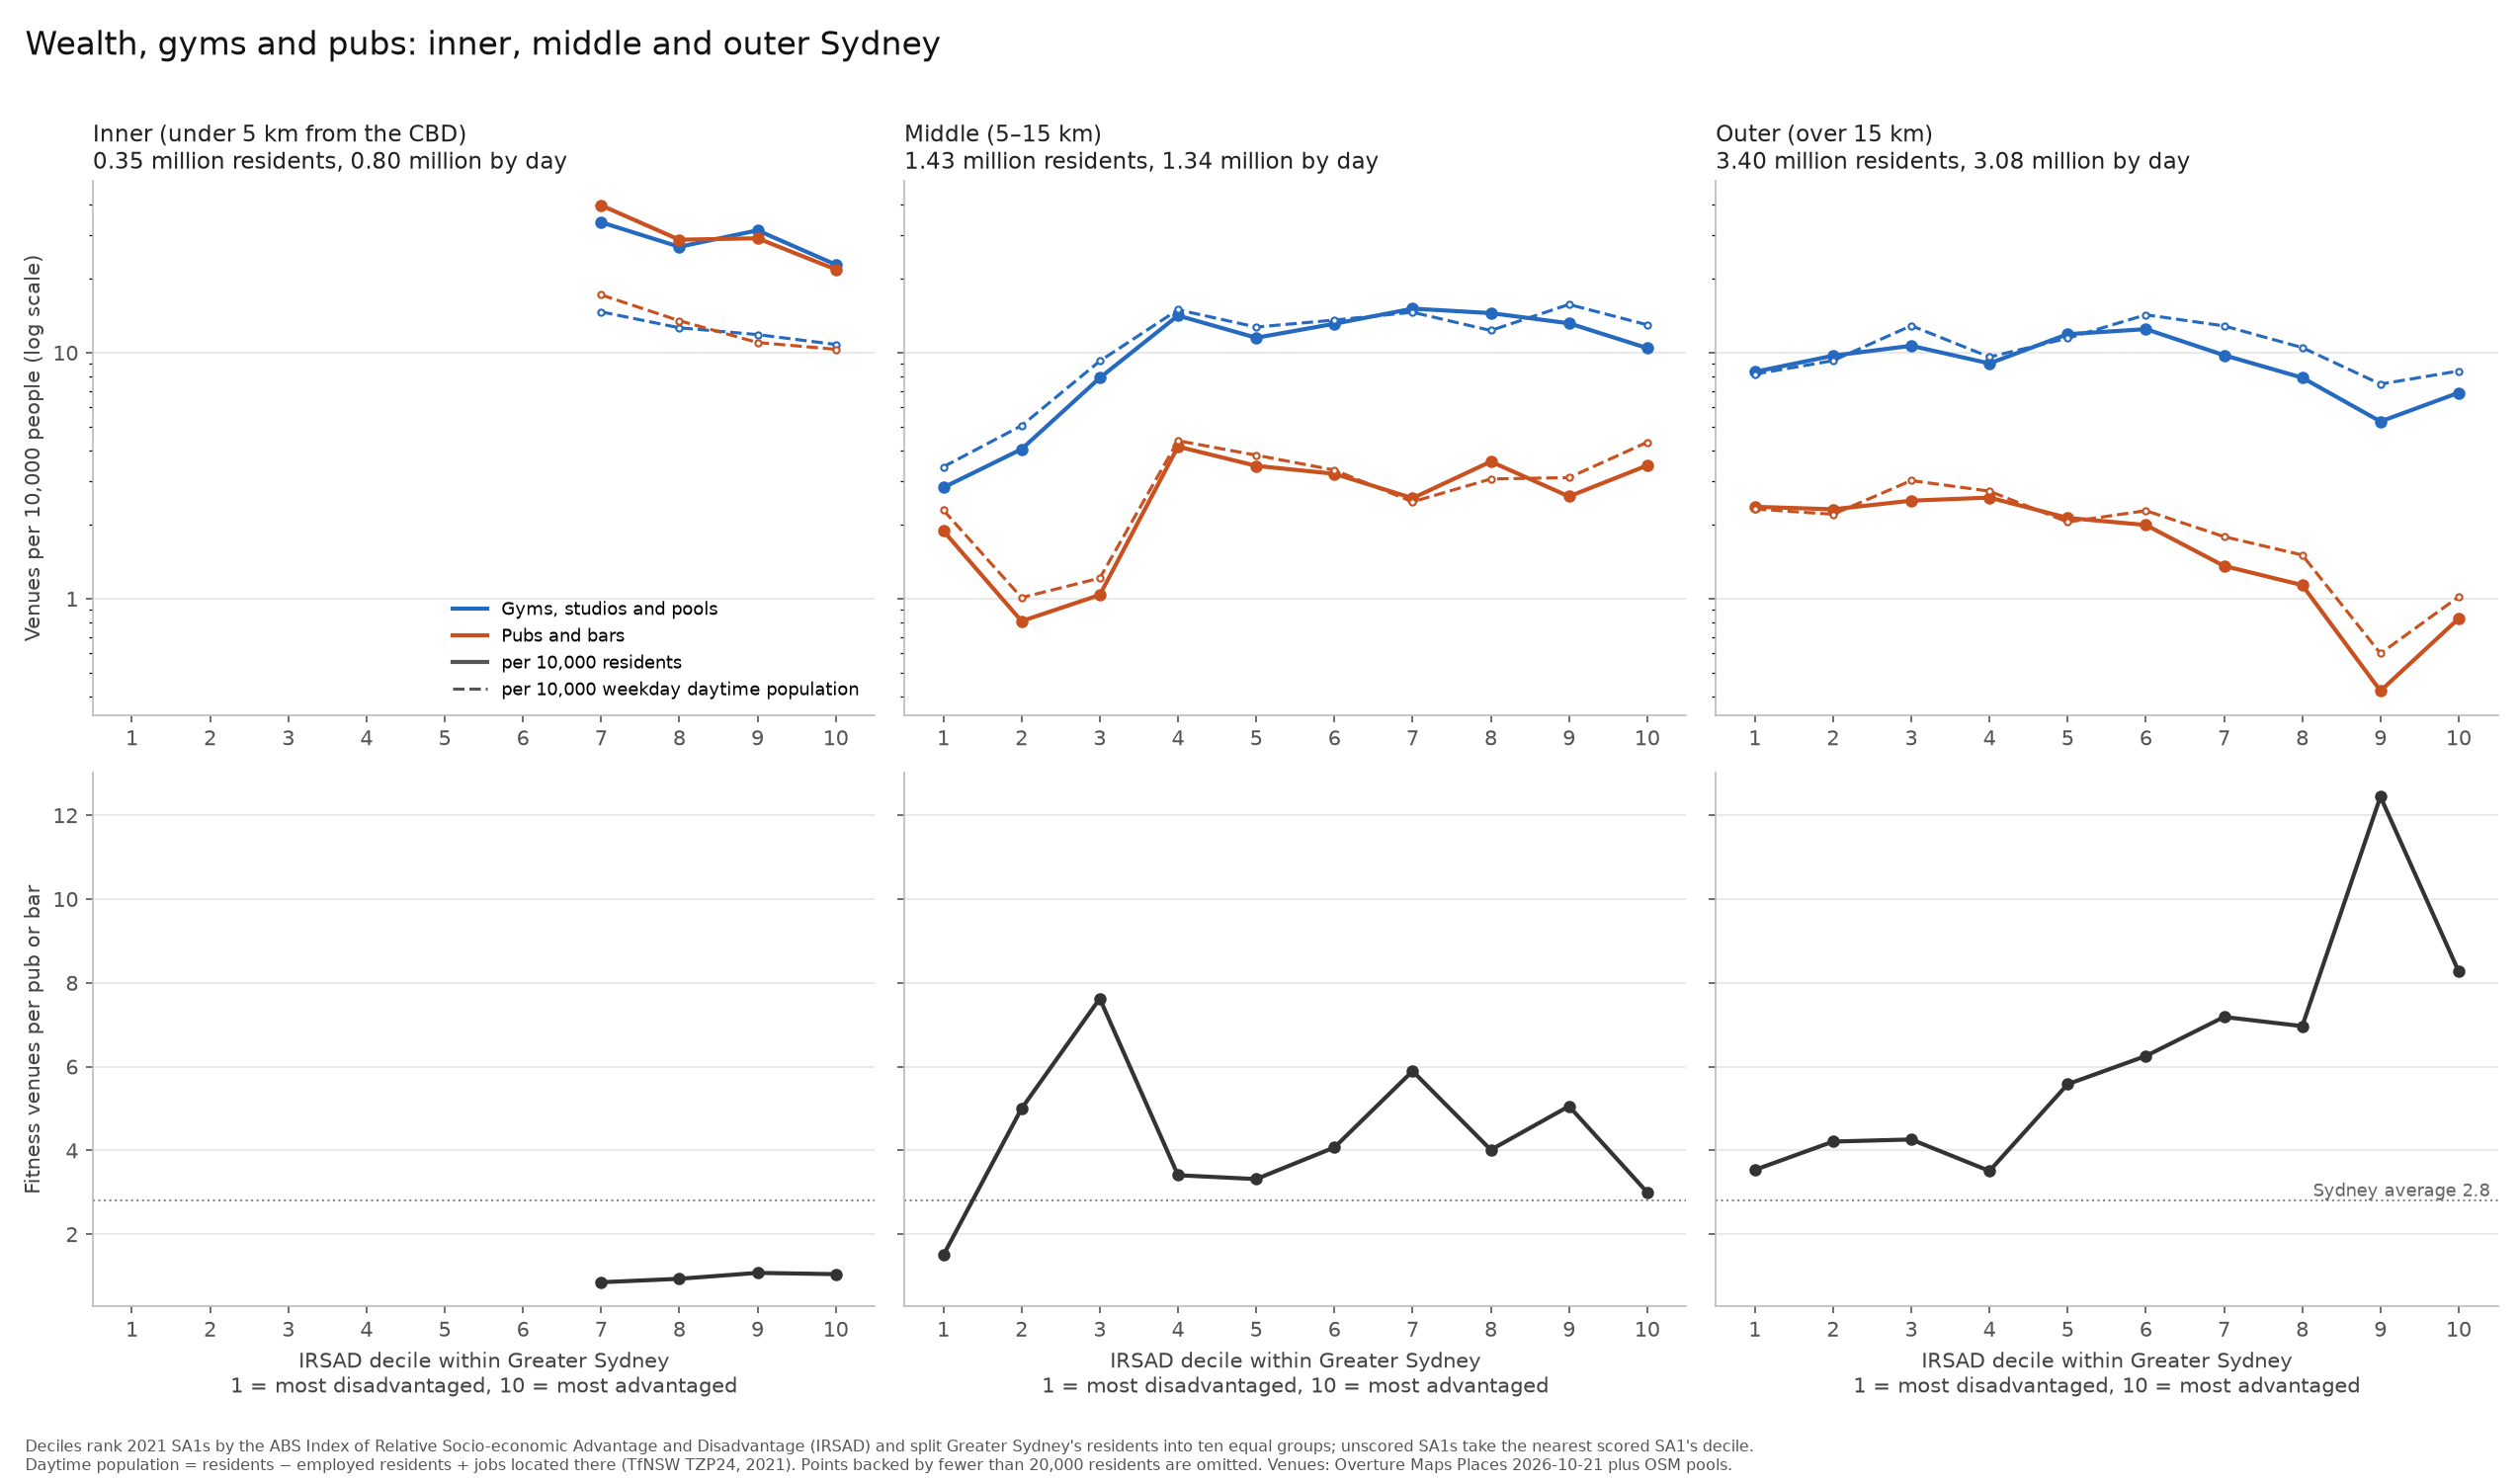
Splitting the city into three rings (inner, under 5 km; middle, 5–15 km; outer, beyond 15 km) separates these effects more cleanly. The inner ring has almost no one below the seventh decile, and there are about as many gyms as pubs at every decile. Outer Sydney, where 65% of residents live, gives the clearest picture. Pubs per resident fall steadily with advantage, from about 2.4 per 10,000 in the bottom four deciles to 0.4–0.8 in the top two. Fitness venues stay between 8 and 12.5 per 10,000 up to the seventh decile and then drop, but not as far, so the ratio climbs from about 3.5 gyms per pub to 8–12.
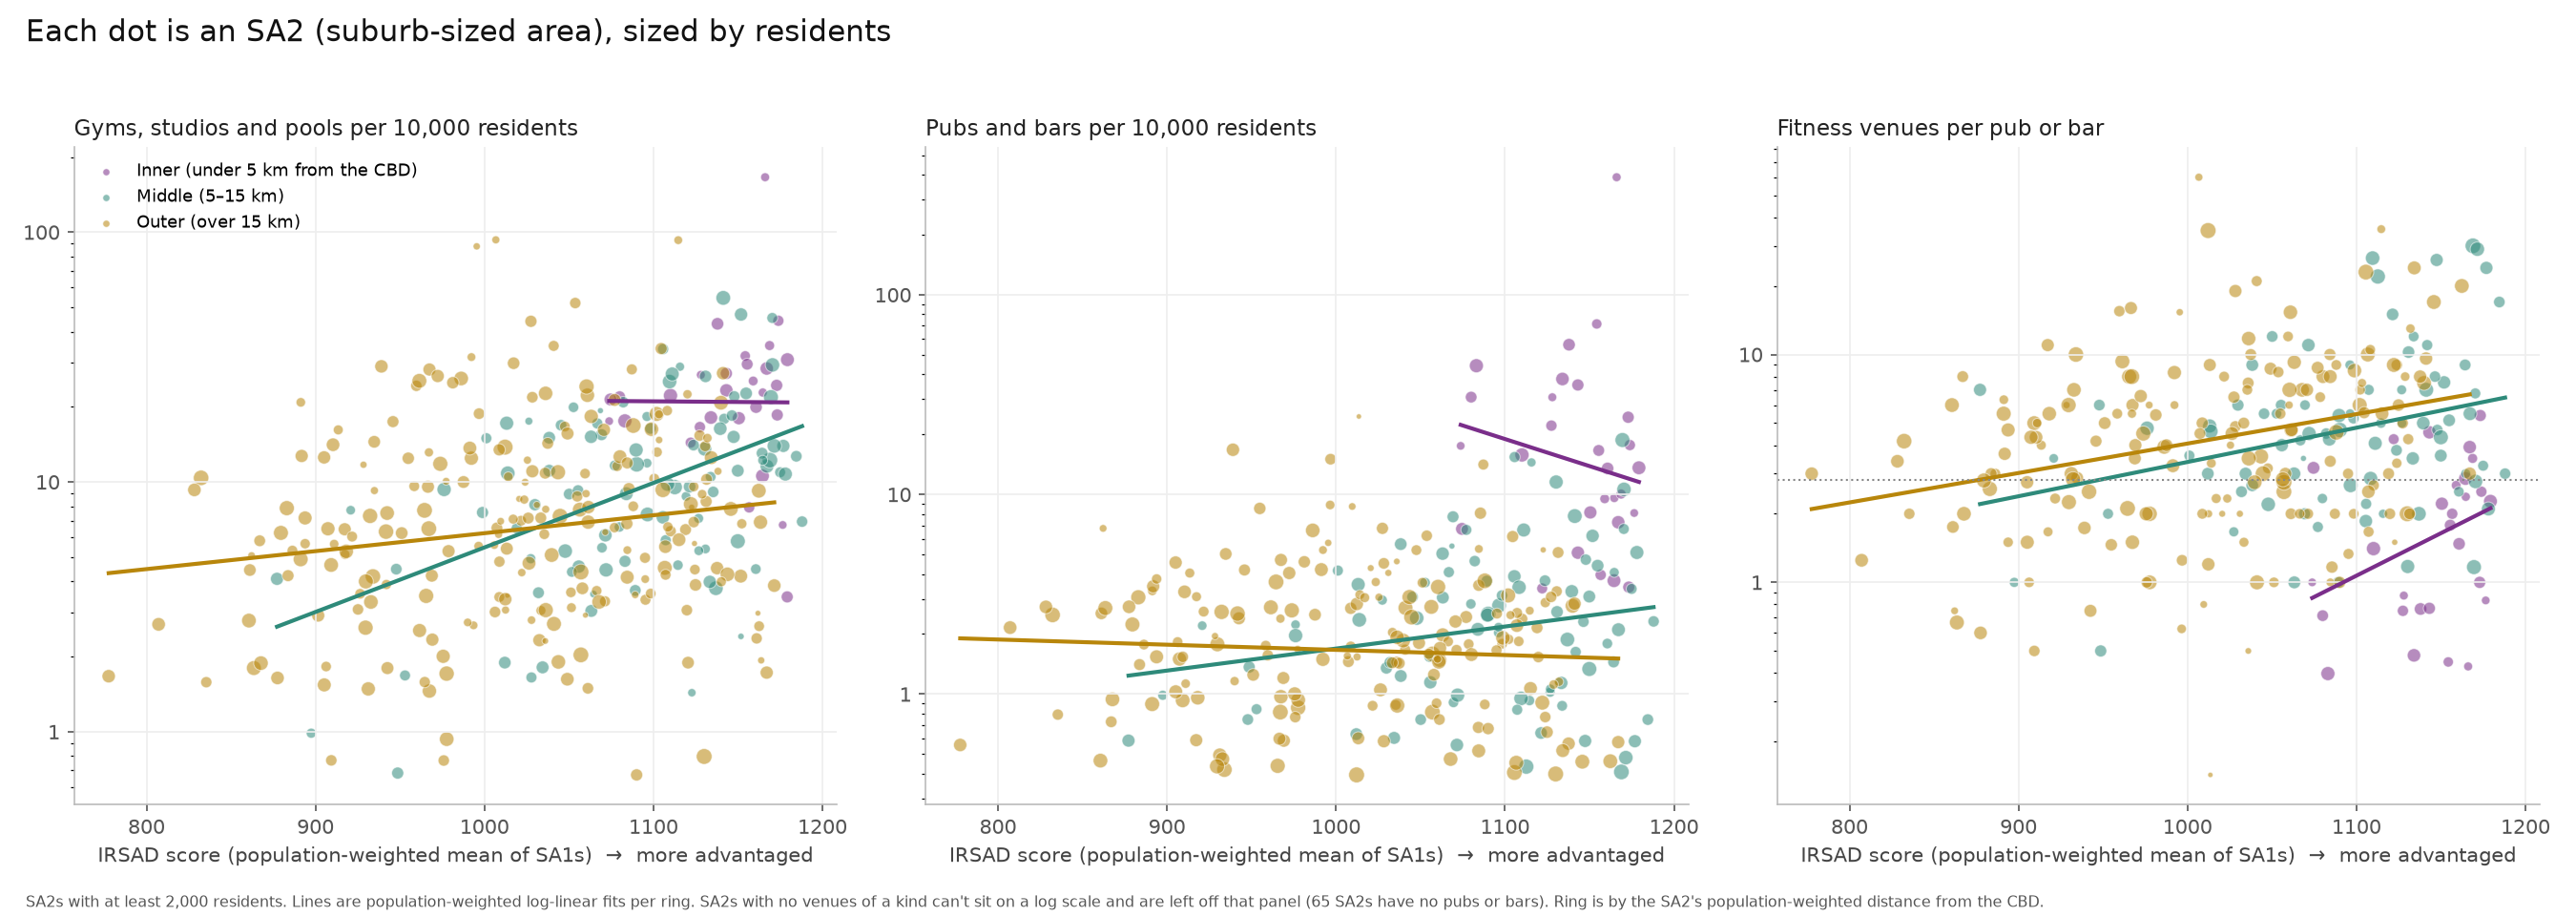
The same relationship holds at the level of suburbs (ABS SA2s), with a lot of scatter. Of 358 suburbs, 65 have no pub or bar, and 5 have no fitness venue.
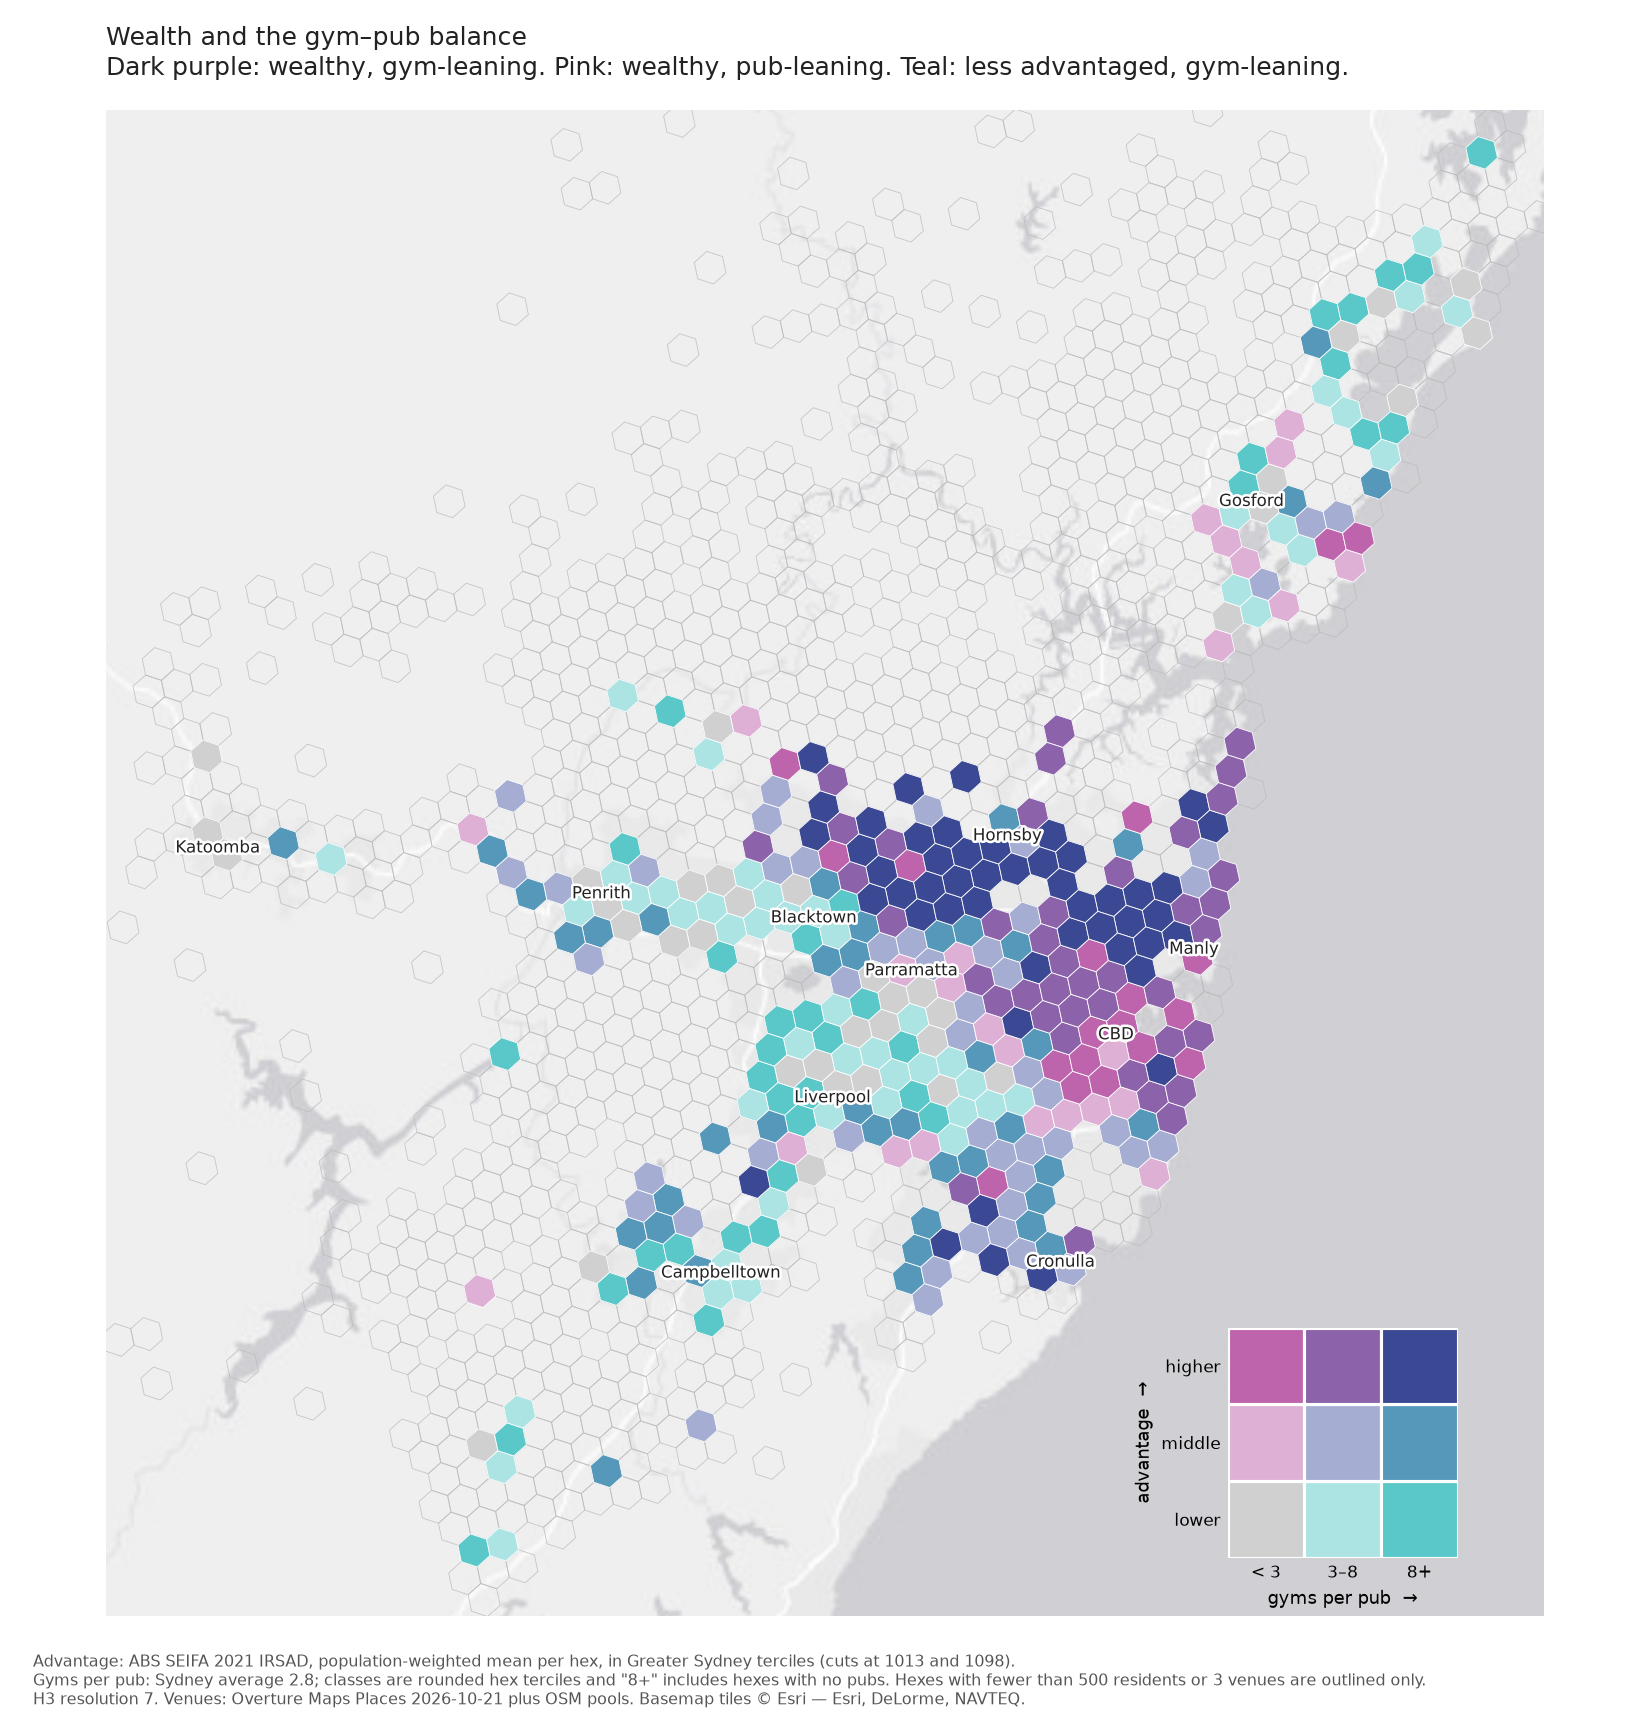
The last map crosses the two measures. Each hex is coloured by its advantage tercile and by whether it has fewer than 3 gyms per pub, 3–8, or more than 8. The Hills, the upper north shore and the Sutherland Shire are dark purple, which means advantaged and gym-leaning. The inner east and the lower north shore are also advantaged but lean towards pubs. Parts of the west around Liverpool and Penrith are less advantaged and still lean towards gyms, because they have few pubs per resident too.
The richest outer suburbs
One detail in the decile chart puzzled me. In outer Sydney, fitness venues per resident drop in the top three deciles, to between 0.55 and 0.83 times the outer-ring average. My guess was that these are dormitory suburbs, mostly houses, and that residents drive to their gyms as they drive to everything else.
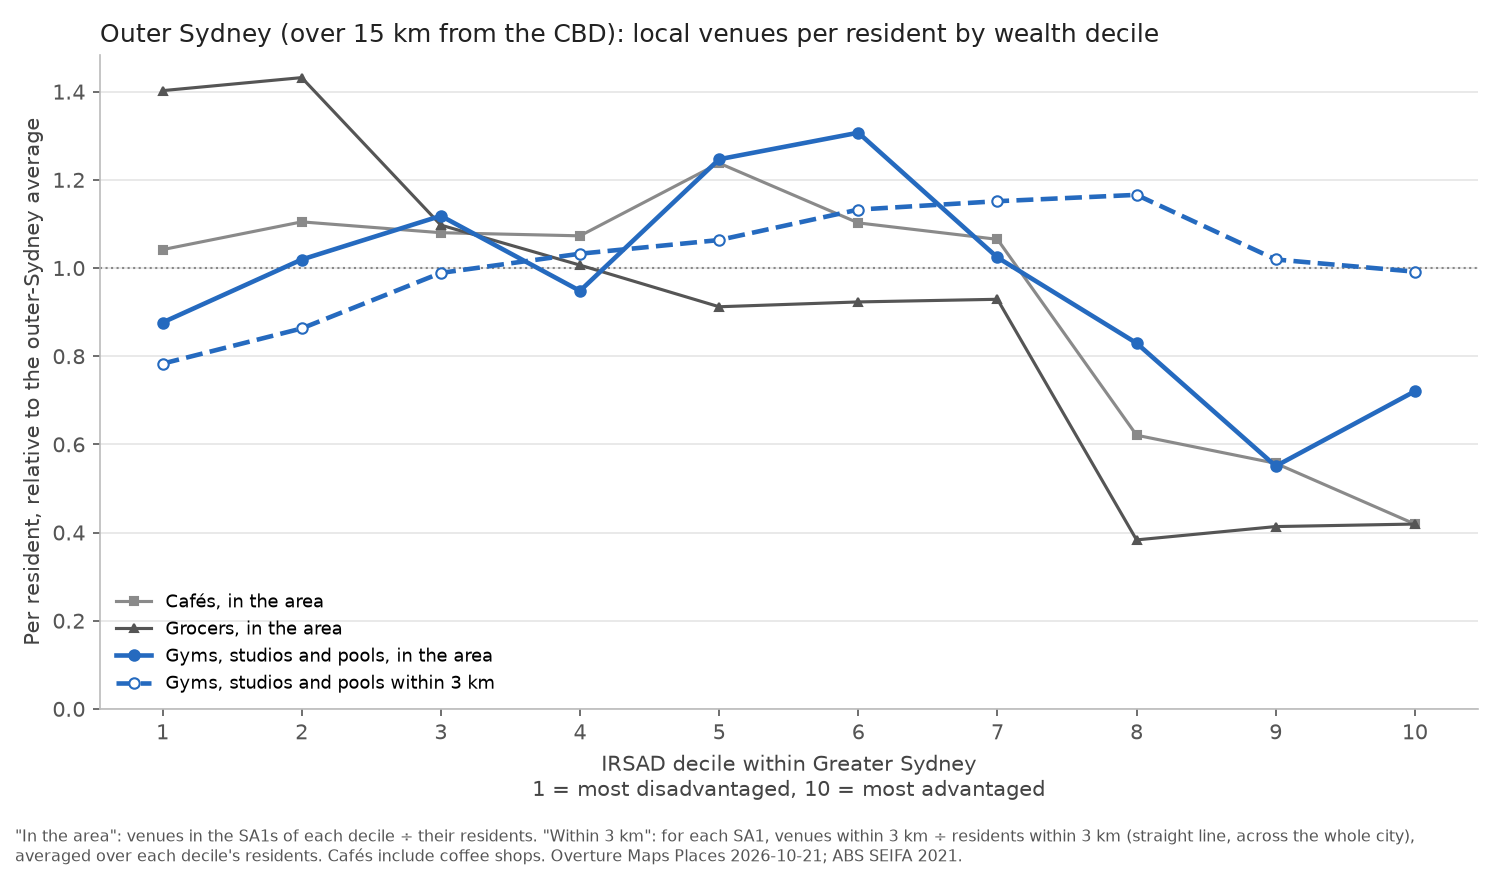
The data is consistent with that, though it can’t show anyone driving. Cafés and grocers drop in the same deciles, to about 0.4–0.6 times the outer average, so these suburbs are short of shops of every kind, and gyms are no exception. Counting instead the fitness venues within 3 km of where people live,10 the drop disappears: the top three deciles sit at 0.99–1.17 times the average. There are gyms within reach of these suburbs, in the town centres and business parks nearby, rather than in the streets where people live.
What the data can’t tell you
These are counts of places, and a count says nothing about size. A 24-hour gym with 3,000 members and a single-room yoga studio are one venue each, as are a 600-person beer hall and a ten-seat wine bar. Nor do counts say who uses them, or how often. The venue database is assembled from sources such as business listings, so it misses some places, keeps some that have closed, and classifies others by guesswork; I have hand-checked the pools and the hotel pubs, but not the rest.11 Licensed clubs, the RSLs and leagues clubs that do much of the drinking in some suburbs, are only counted when the database happens to call them bars.
None of it says anything about whether Sydney cares more about how it looks than how it performs. What it does show is a city where pubs gather where people work and go out, and fitness venues follow where people live, with the gap widest in the advantaged outer suburbs.
-
The Grouse Grind is a 2.9 km trail up Grouse Mountain in North Vancouver, climbing about 850 m. People time themselves on it with a timing chip a bit like an opal/oyster card. ↩
-
Milan Janosov, ‘607 pubs. 134 gyms. Same fifteen-minute walk.’, The New Science of Maps. His question was close to mine, though his method is different, and so is his definition of a gym. He used walking distance along the street network; I used straight-line distance and hexagons, which is simpler and, at the scale of a whole city, I think gives much the same picture. ↩
-
The full list of categories is in
scripts/02_build_hexes.py. Public pools are hand-curated from OpenStreetMap because the source database’s swimming-pool category mixes public pools with swim schools and pool-supply shops. ↩ -
Overture Maps Places, release 2026-10-21.0, a free database of points of interest assembled from Meta, Microsoft and other sources. I kept records with a confidence score of 0.5 or more; below that they are mostly junk. ↩
-
The exclusions are a list of chain names and words like ‘motel’, ‘apartments’ and ‘suites’. A hotel pub that duplicates a bar within 100 m with matching name words is dropped. The rule lets in some boarding houses and misses pubs that don’t have ‘hotel’ in their name. ↩
-
Uber’s H3 hexagonal grid, at resolution 7. Hexes with fewer than 500 residents are greyed out in the per-resident maps, because small denominators produce extreme rates. ↩
-
ABS 2021 Census counts by mesh block, the smallest unit the ABS publishes, typically 30–60 dwellings. Each mesh block is assigned to the hex that contains its centre. Results from the 2026 Census aren’t due until 2027. ↩
-
Daytime population = residents − employed residents + jobs, using Transport for NSW’s Travel Zone Projections 2024 for 2021, spread from travel zones to mesh blocks with TfNSW’s own concordance. It leaves out shoppers, students and tourists, so it understates the CBD’s daytime crowd. ↩
-
ABS Socio-Economic Indexes for Areas (SEIFA) 2021, published by SA1, areas of about 200–800 people. Deciles here are re-ranked within Greater Sydney, weighted by population, so each holds a tenth of Sydney’s residents. A few SA1s, mainly business parks and the CBD core, have too few residents to be scored; they take the decile of the nearest scored area. ↩
-
Venues within 3 km in a straight line, divided by residents within 3 km, calculated for each SA1. ↩
-
The repository’s README and notes list the known gaps in more detail. ↩