Lecture 6: Working with data
First thing’s first! This is the first week of the second half of the course. That’s important because things change a bit from now on.
lab sessions are about you working on your project, with the tutors here to help you get your ideas straightened out.
There’s no homework any more, but there is a giant sumbission at the end of week 14, so don’t take your foot off the gas!
Theory
What do we mean when we say data?
That’s a big and thorny question! I like to think of it as a lifecycle of sorts. Let me try an analogy and then get back to data.
- When oil is in the ground, it’s not really oil in the sense that we can use it or sell it, it’s just plant matter that’s in various states of decay.
- Once it’s been pumped out then it’s oil, Texas tea, crude, black gold. Even then, only a few people want to buy it because it’s not all that useful.
- It goes off to the refinery and is turned into petrol, tar, plastic feedstock, etc. It’s useful to a much bigger audience now.
- We can make the plastic feedstock into bottles and boats and toothbrushes and then it’s really useful.
- That stuff will stick around for a long time, some of it’s useful, but a lot of it’s junk!
You can call this a process of adding value1, and the same is true of data.
- Configurations of nature exist without us2.
- Through some sort of instrumentation we observe those configurations, and record them. Either as memories through our senses and into our brains, as squiggles on a paper tape with a seismograph, or as binary values on a magnetic disk from a laser scanner. At this point it’s crude-data, or as most people say, just data.
- Those data are then collected, aggregated and presented to an observer. That could be our reflective selves, thinking about our memories. It could be the earthquake expert looking at the paper tapes, or it might be the surveyor looking at the results of the laser scan. At this point, I’d like to think of this as Information.
- The observer now has that information in their brain, they fit it in with their existing stock of information. Updating ideas, throwing some out that don’t work any more, and finding a place for all the new stuff3. At this point we can usefully call this knowledge.
- Once knowledge has been around for a while, it becomes wisdom. I’d caution you to be sceptical when something is presented as wisdom, as it’s almost always wrong. The half-life of knowledge4 is surprisingly short.
Tiny intro to Information Theory
Claude Shannon5 (April 30, 1916 – February 24, 2001) came up with the mathematics and theory of information. A lot of it seems pretty obvious but that’s the nice thing about good mathematics, it often does.
The key thing was that you could measure how much information was in some data.
0000000000000000
has a lot less information than
ZW#%Zr3nJpGjB6j6
even though they are both 16 characters long. The minimum amount of information needed to communicate the first is something like 0×16 but there isn’t a representation of the second that’s any shorter than itself, i.e. ZW#%Zr3nJpGjB6j6. This realisation led to all the cool stuff like jpg compression and Netflix.
This is the other way you might hear people talking about information, the mathematical sense of the word.
Displaying data
Data vis is so cool these days that it’s become almost completely meaningless. Did you leave a coffee ring on a newspaper? Datavis of coffee placement! Did you look at a clock? Datavis of time’s relentless passage!
I’m only half mocking these things, they really are data vis in some sense. The wear pattern on your shoes visualises your gait in a really telling way for a forensics person. But, let’s restrict ourselves to more intentional versions.
The first thing to think about is what sort of data do we have, there are really 3 types:
- Continuous data, e.g. volume of water in my cup at time t
143.40or75.29403 - Discrete data, e.g. how many cups do I have?
1or7(We can often lump this is with continuous for plotting) - Categorical data, e.g. the name of each person who made my cups.
BeateorBeatrix
And there’s one more special case of continuous that comes up so much that it deserves a special mention: time.
The simplest type of plot is where you take categorical values and put them into piles.

People usually think of this as a bar plot.
A special case of bar plots is the histogram. You take a continuous value and depending on where it is you throw it into a bin. A bin might be values from 0-10 and then the next will be values from 10-20 and so on. If we have a lot of continuous values that aren’t time related, it often makes sense to use a histogram.
Histograms are also very useful for statistical analysis. Their shape (mean, spread, skew) can tell you a lot about the data set.
The plot that comes to mind most easily is where you plot y against x, usually time, but not always.
Important things for all charts: title, axis titles (with units), a sense of decency.
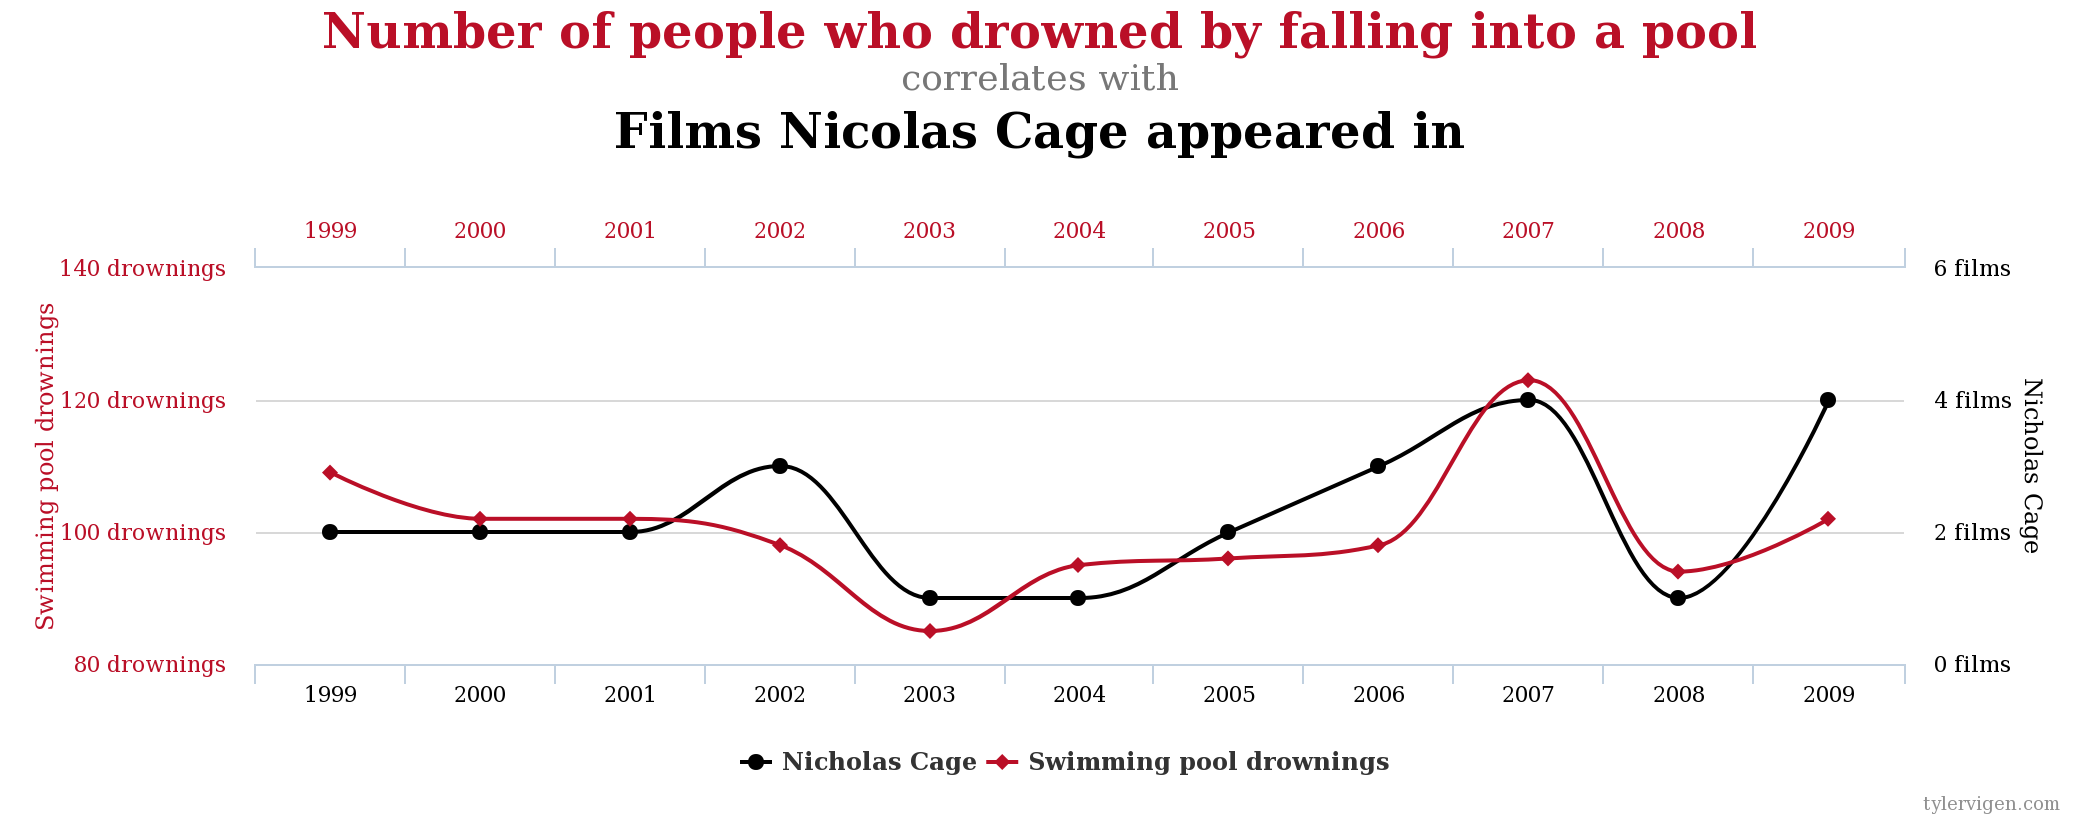
It’s extremely easy to mislead with charts/graphs/plots, take a look at a graph in a disreputable newspaper and see if it’s telling the whole story. There is a load of this sort of stuff in The Wall Street Journal Guide to Information Graphics that’s in this week’s reading list.
Technology
We’re going to switch environments this week. We’re no longer in atom, we’re in a Jupyter Notebook.
Jupyter Notebooks
Notebooks run in your browser. They are a way for you do do exploratory programming.
You can run your code one section at a time. The notebook will maintain state between them too.
This means that you can get a bunch of data into memory, which might take a long time, and then you can prod it all day without having to reload it.
The other important thing is that you can output non-text results. So graphs and tables can easily be produced.
The two libraries we’ll be using are Pandas and Matplotlib:
Pandas :panda_face:
The core library for almost all of the data analysis work in python is pandas.
It provides a few really powerful data structures, and a whole load of tools for doing operations on those data.
Tutorials
The tutorials below are probably the most commonly referenced pandas tutorials. The Pandas Cookbook and Learn Pandas are both already structured into Jupyter Notebooks, so you can play along at home if you download the notebook from their repos.
There also are a gazillion pandas tutorials on youtube so try a few out and see who you like best.
Pandas Cookbook
The goal of this cookbook is to give you some concrete examples for getting started with pandas.
What more could you want out of life!? This is really nice as a complement to the docs. If there is something that looks a bit hard to understand (and the pandas docs can often be pretty overwhelming!) then this might well have a worked example of how to do that thing.
Learn Pandas
This is pretty thorough! Once you’ve finished this and the cookbook you can pretty much consider yourself a data pro!
Pandas & Seaborn - A guide to handle & visualize data elegantly
This is a nice intro to pandas, and a gentle intro to seaborn, which is a simplified version of matplotlib. It uses the Titanic dataset, which is about who was on board the Titanic when it sank. It’s got things like each passenger’s ticket class and if they survived or not.

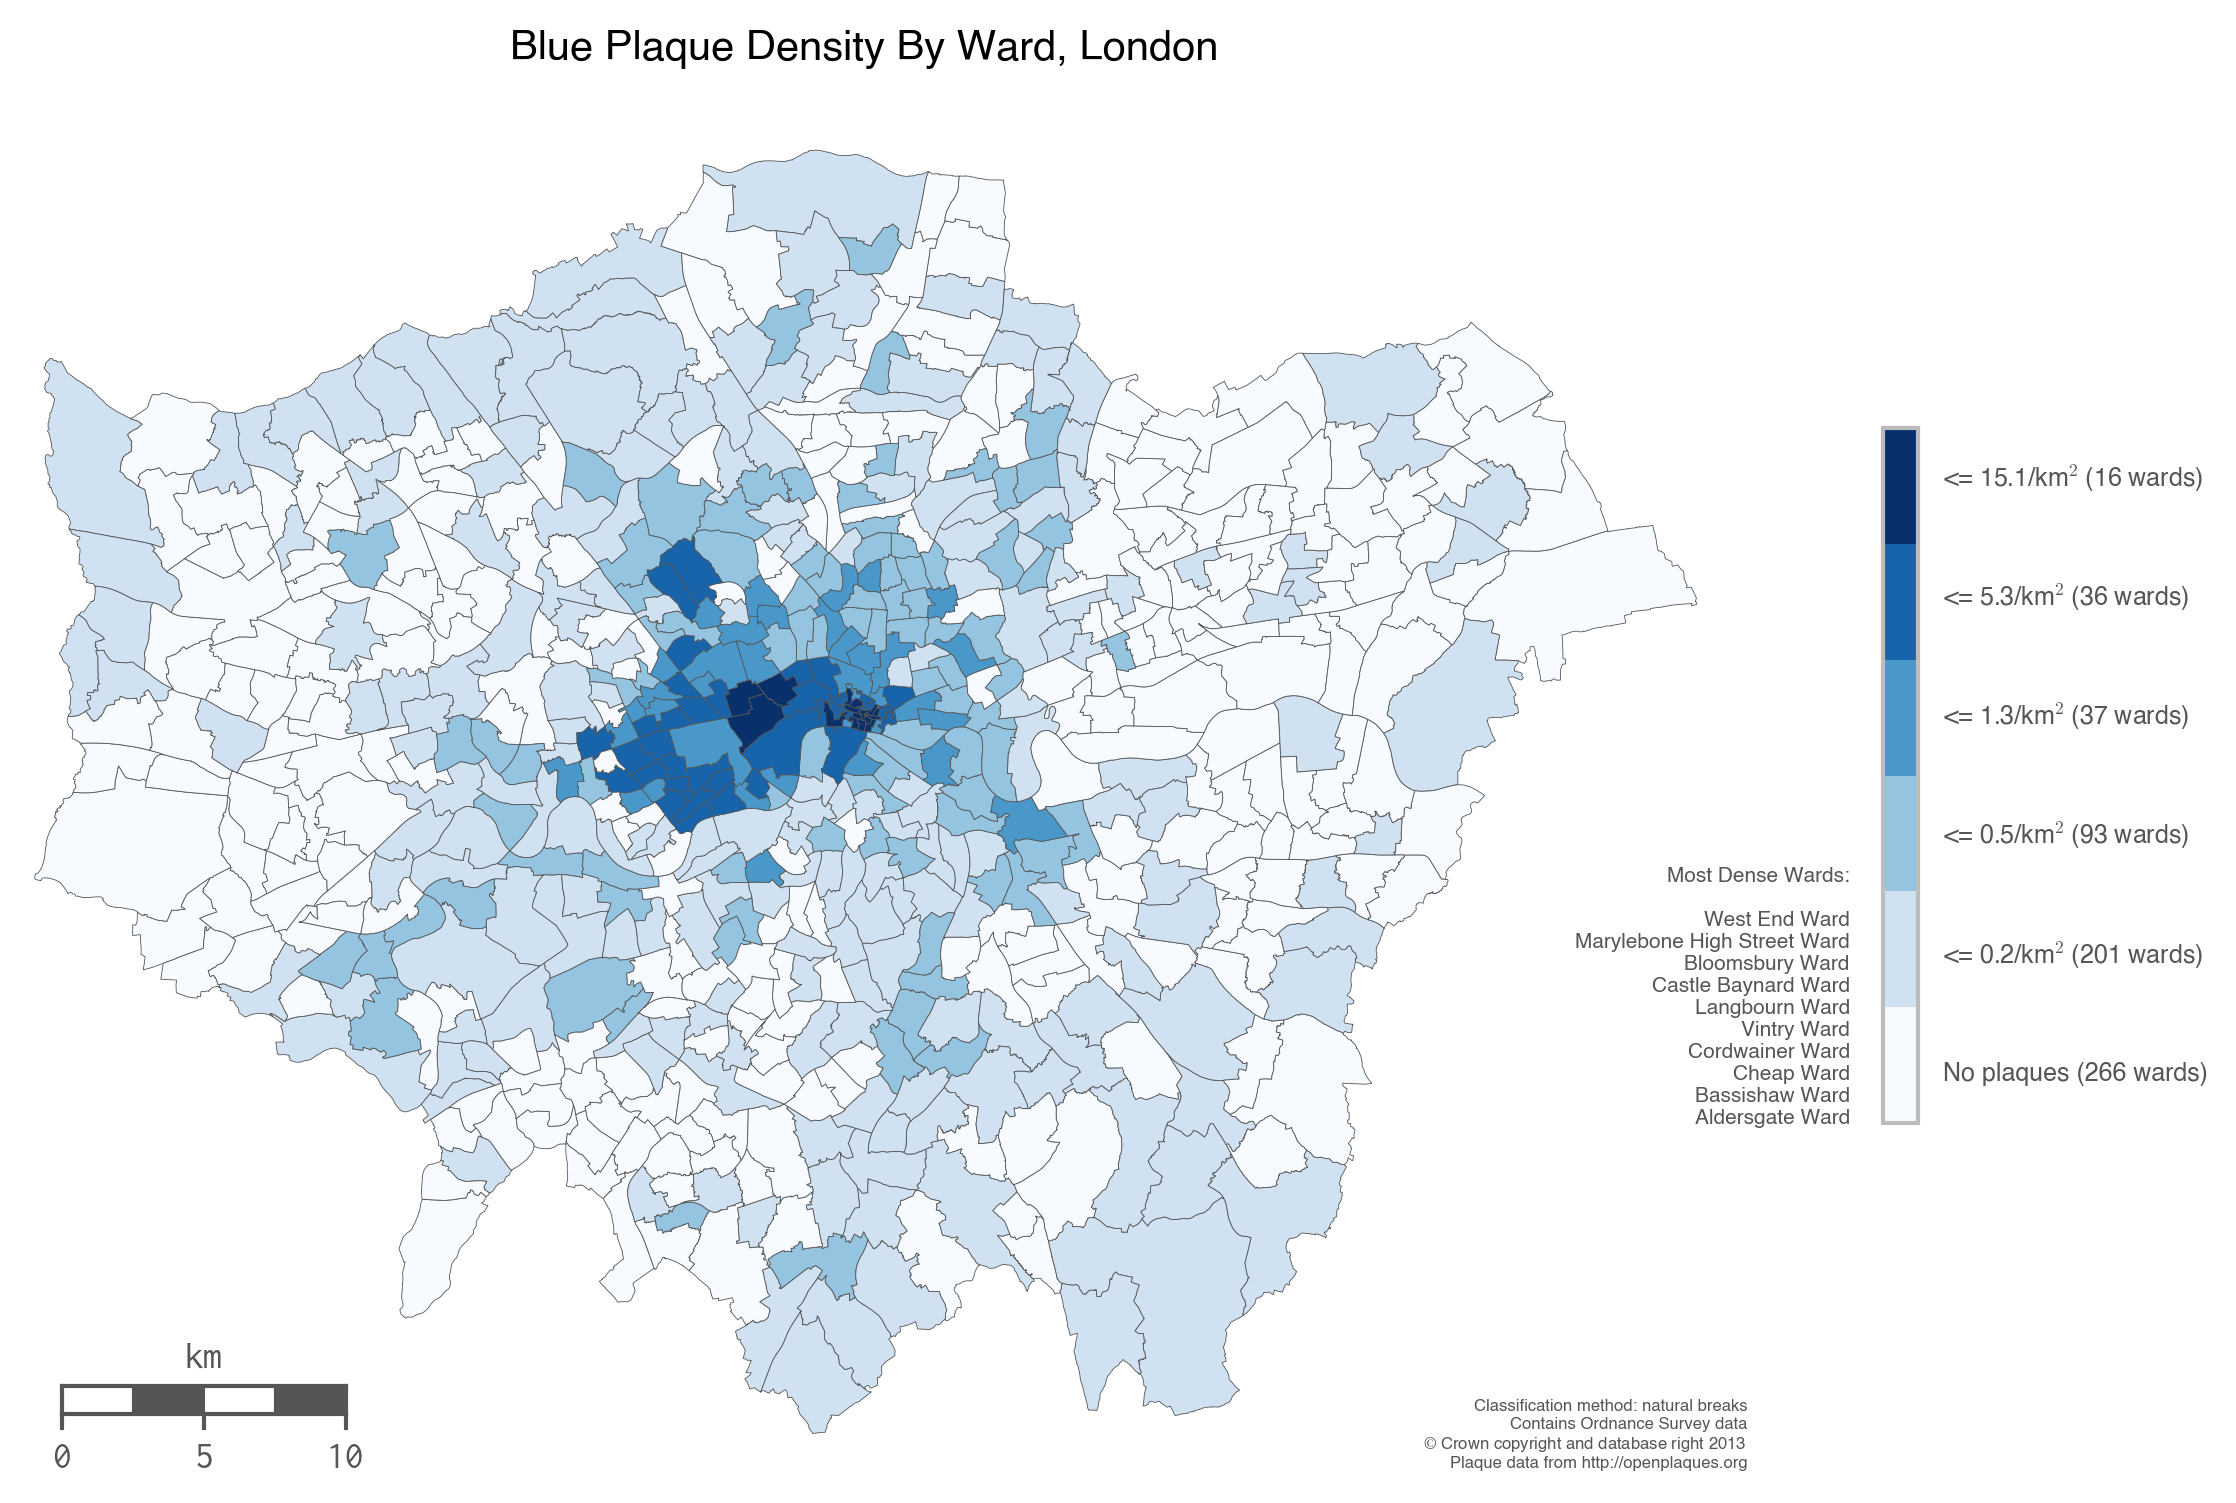
So You’d Like To Make a Map Using Python
I have to admit, I haven’t gone through this tutorial, but it looks good. A fairly simple introduction to how to do maps with pandas and choropleth maps. (This one is for people who are feeling brave!)
Talk is cheap, show me the code:
Github does a very nice job of showing notebooks. Here’s this week’s one. Once you have it downloaded, you can go through it and tweak the variables etc.
This week’s reading :books: / :headphones:
:headphones: Polich, K. (2016). Let’s Kill the Word Cloud.
:books: Tufte, E. (2001) The Visual Display of Quantitative Information. Read chapter 4: Data-Ink and Graphical Redesign. If you feel so inclined, read the whole book!
:books: Wong, D. (2010) The Wall Street Journal Guide to Information Graphics: The Dos and Don’ts of Presenting Data, Facts, and Figures.
This week’s homework
There isn’t any homework from now on, but we’ll continue to suggest things that you should do. These things are usually vital steps in your data project, that you can bring with you to tutorials to talk through with people.
-
We can debate if any value of any value is added, but go with me for the moment. ↩
-
You can also argue that the earth is processing data too. It’s a pseudo religious position to take, that all matter is information processing. One that I’m quite sympathetic to, but it’s not really the issue at hand here! I’m deliberately taking an anthropocentric view to get the point across, we can be nuanced later. ↩
-
At least that’s what is supposed to happen! The brain is way more broken than you’d imagine, what really happens is fascinating, and if you are interested in all the ways that we are irrational, take a look at “Thinking Fast and Slow” By Daniel Kahneman. It’s a summary of lots of the important work in that area, and it’ll get you started. ↩
-
https://en.wikipedia.org/wiki/Half-life_of_knowledge ↩
-
Shannon was another one of the computer heroes, read his wikipedia page, he did some cool stuff, like learning how to beat casinos at blackjack! ↩