Assignment 3–Open Data Project
Part a–Data Explorers and Storytellers
This is the capstone project for this course. You will take an open data set, probably from the NSW government collection and build a way to present it to others.
You will use any available libraries or frameworks to do so, although py.processing and matplotlib are recommended. The marks will be awarded for:
- Code quality: Is the code tidy, is it modular, is it self documenting, does it use efficient algorithms etc.
- Data manipulation: has the raw data been transformed well, and repeatably.
- Quality of output, is the ‘front end’ of your project successful, is it supported by data visualisation and HCI principles?
- Depth of insight: Does your system lead to a greater understanding of the phenomenon described by the data? What did you find in the data that you wanted to share with others?
- Final presentation: was the presentation clear and well rehearsed? Did it get the salient points across? Was it technically deep while avoiding jargon?
DELIVERABLES: A presentation and demonstration of your data exploration tool in week 14’s contact time. Your GitHub Repository will be marked at its state at 7pm Tuesday of week 15.
This is your chance to shine and let all the things you’ve learnt so far to use.
There is lots of open data out there already, and more is added all the time. There are interesting patterns, insights and discoveries waiting to be uncovered by someone who is patient and inquisitive.
Australia publishes lots of data here: data.nsw.gov.au and there are lots of other sources of data from governments, NGOs and companies around the world. There are datasets curated on GitHub too, like this one about Uber.
Whatever you choose to explore, it will really help if you understand what you are looking at. Read around the topic; if you decide to do trees—learn about trees, if you decide that you are going to look at buses—become an expert on buses. This is a key programmer/data person skill, you need to be able to become an expert in a domain very quickly.
You’ll also find it a lot easier if you are trying to answer a question. “Are there more trees per person in Sydney or in Melbourne?” or “When I flush the toilet in NSW, what path does it take to the ocean?”. If you just download a data set and look at it, you’ll have a hard time.
Do these things to make your life better in the long run:
These tasks are going to feel like an imposition. They aren’t marked, but doing them will make everything so much easier. Think of it as a warm up; you don’t get any Olympic medals for warming up, but you’ll never 🏅🏅in one if you don’t warm up! These are good things to put into your lab book.
- State your question. Be very clear about what you are asking. This will make communicating with your tutors a lot easier too.
- Document your data source. Where did you get it from? When?
-
Document the data. If it comes as a table, what does each column mean? What type of data is it. E.g. this is some data from an Uber data set:
"Date/Time","Lat","Lon","Base""4/1/2014 0:11:00",40.769,-73.9549,"B02512"This is fairly obvious, but what does the datetime actually mean? Is it a pick up time? Same for the lat long. What is Base?
This is a simple data set, some of the government sets have a lot more columns. Going through them and documenting their data-type and being specific about what they refer to will be really good for you.
- Your data is rarely in the format that you actually want it to be. You’ll have to do things to it to make it useful. You should never go into the data’s file and change it, that’s very bad. You should write code to convert the source format into the format you need. This is good because it makes your process explicit, which is sharable and ethically good, and also because if the data changes then you don’t need to do any more work. Some data changes constantly (e.g. Twitter) others are slower, but even weekly data needs to be updated more often than doing it manually is OK for. (This part is actually marked!)
- Think about your story. In your career you’ll be looking at a data set to help you tell a story. If you know what that story is then you’ll find it a lot easier to find supporting graphs and statistics to tell it for you. (The only people I can think that this doesn’t apply to are solo investors, and even they are probably telling a story to themselves!)
- Make a lot of charts. Take advantage of the default graphs in matplotlib, there’s no point making a really amazing graph of an unimportant fact. Make sure that the graph supports the story before you spend a lot of time making it amazing.
For your final presentation, tell a story! (Samuel, A. (2015). How to Give a Data-Heavy Presentation. is in the reading list) Make everything you show us support that story. You get marked in two parts for this assignment. 20% in the actual presentation in week 14, and then another 15% in week 15. The details of the breakdown is in the course outline. I spent a long time writing the course outline, and as well as helping my ego, if you read it you’ll find out what is going to be rewarded with marks.
Part b–Git collaboration
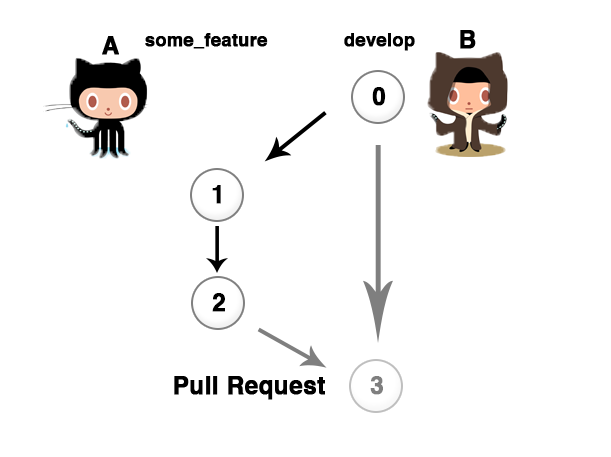
Help yoda octocat to make everything awesome.
One of the greatest things about being a student is having a cohort to go through the struggle of your courses with. One of the greatest things about open source culture is that there is a way for you to share the burden by helping each other out.
This is a mark that is available to anyone who makes a Pull Request to anyone else’s repository during the Open Data Project and has it accepted.
Deliverables: Proof of an accepted pull request, in both directions, described in your lab book.
You’ll be going through this course with a whole bunch of other people. This mark is a chance to show that you are able to contribute to other people’s work, and for other people to contribute to yours.
This will reward people who have well maintained README files and who structure their code well.
You can see the pull requests that you’ve made here and the onse that people have made to you here. If there’s at least one PR in each of them that isn’t to your own repo then you get the marks! Don’t feel like you have to stop at one. Build up some good karma by helping each other out.