prep for tropos
Sensicorn: The big picture
[TODO: write this post!]
Wearing the badge
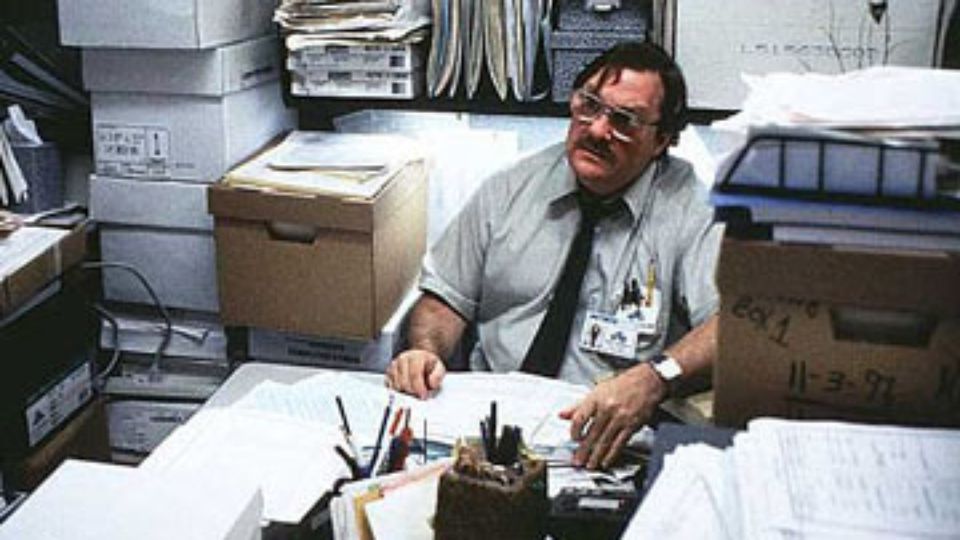
The Sensicorn[1. We haven’t come up with a good name yet. Feel free to make some suggestions.] system won’t detect you if you aren’t wearing your badge, here’s some tips on how to wear it heaps fashunable:
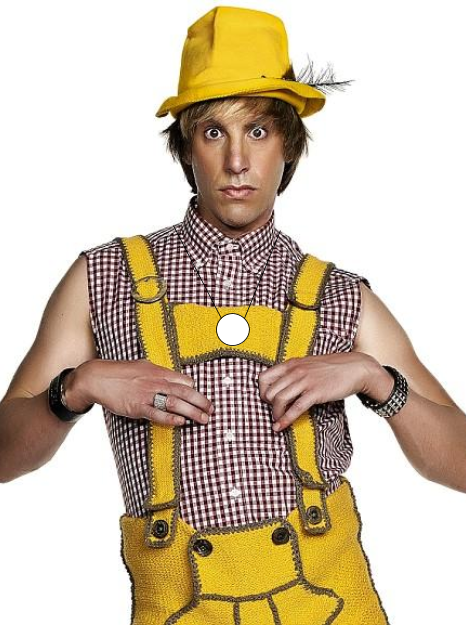

Our man Bruno showing off how to wear the badge.
The broadcast is shaped by your body. For a much more detailed look at this, Annisa has written about it here.
- Wear it around your neck! You’ve probably heard that you have a lot of water in you. Cool fact! The big watery lump of meat behind the badge shapes the signal in a predictable way. If it’s in your pocket or tied to your ankle then it’ll do horrible things to our data.
- If you want to shorten the cord just put a lazy overhand knot behind your neck.
- It doesn’t matter which way around it is. We intended for the sticker to be on the outside, but it’s up to you.
- Customise! Feel free to put googly eyes on it, or to make it into a felt animal. The only limit for this is no metal or magnets. If you are unsure then just ask me. It’d be fun to 3d print a shape to go over it; maybe a wombat’s head?
If you want to opt out of the experiment then that’s totally OK! The only caveat to that is that we’d like you to keep wearing the badge, just take the battery out. That way you won’t be marked as an opter-outer. If you’d like some help getting the battery out then just grab me. If you want to do it yourself then just push your palms together on the badge and twist. Make sure to keep the battery safe though.
The broadcast is shaped by your body. For a much more detailed look at this, Annisa has written about it here.
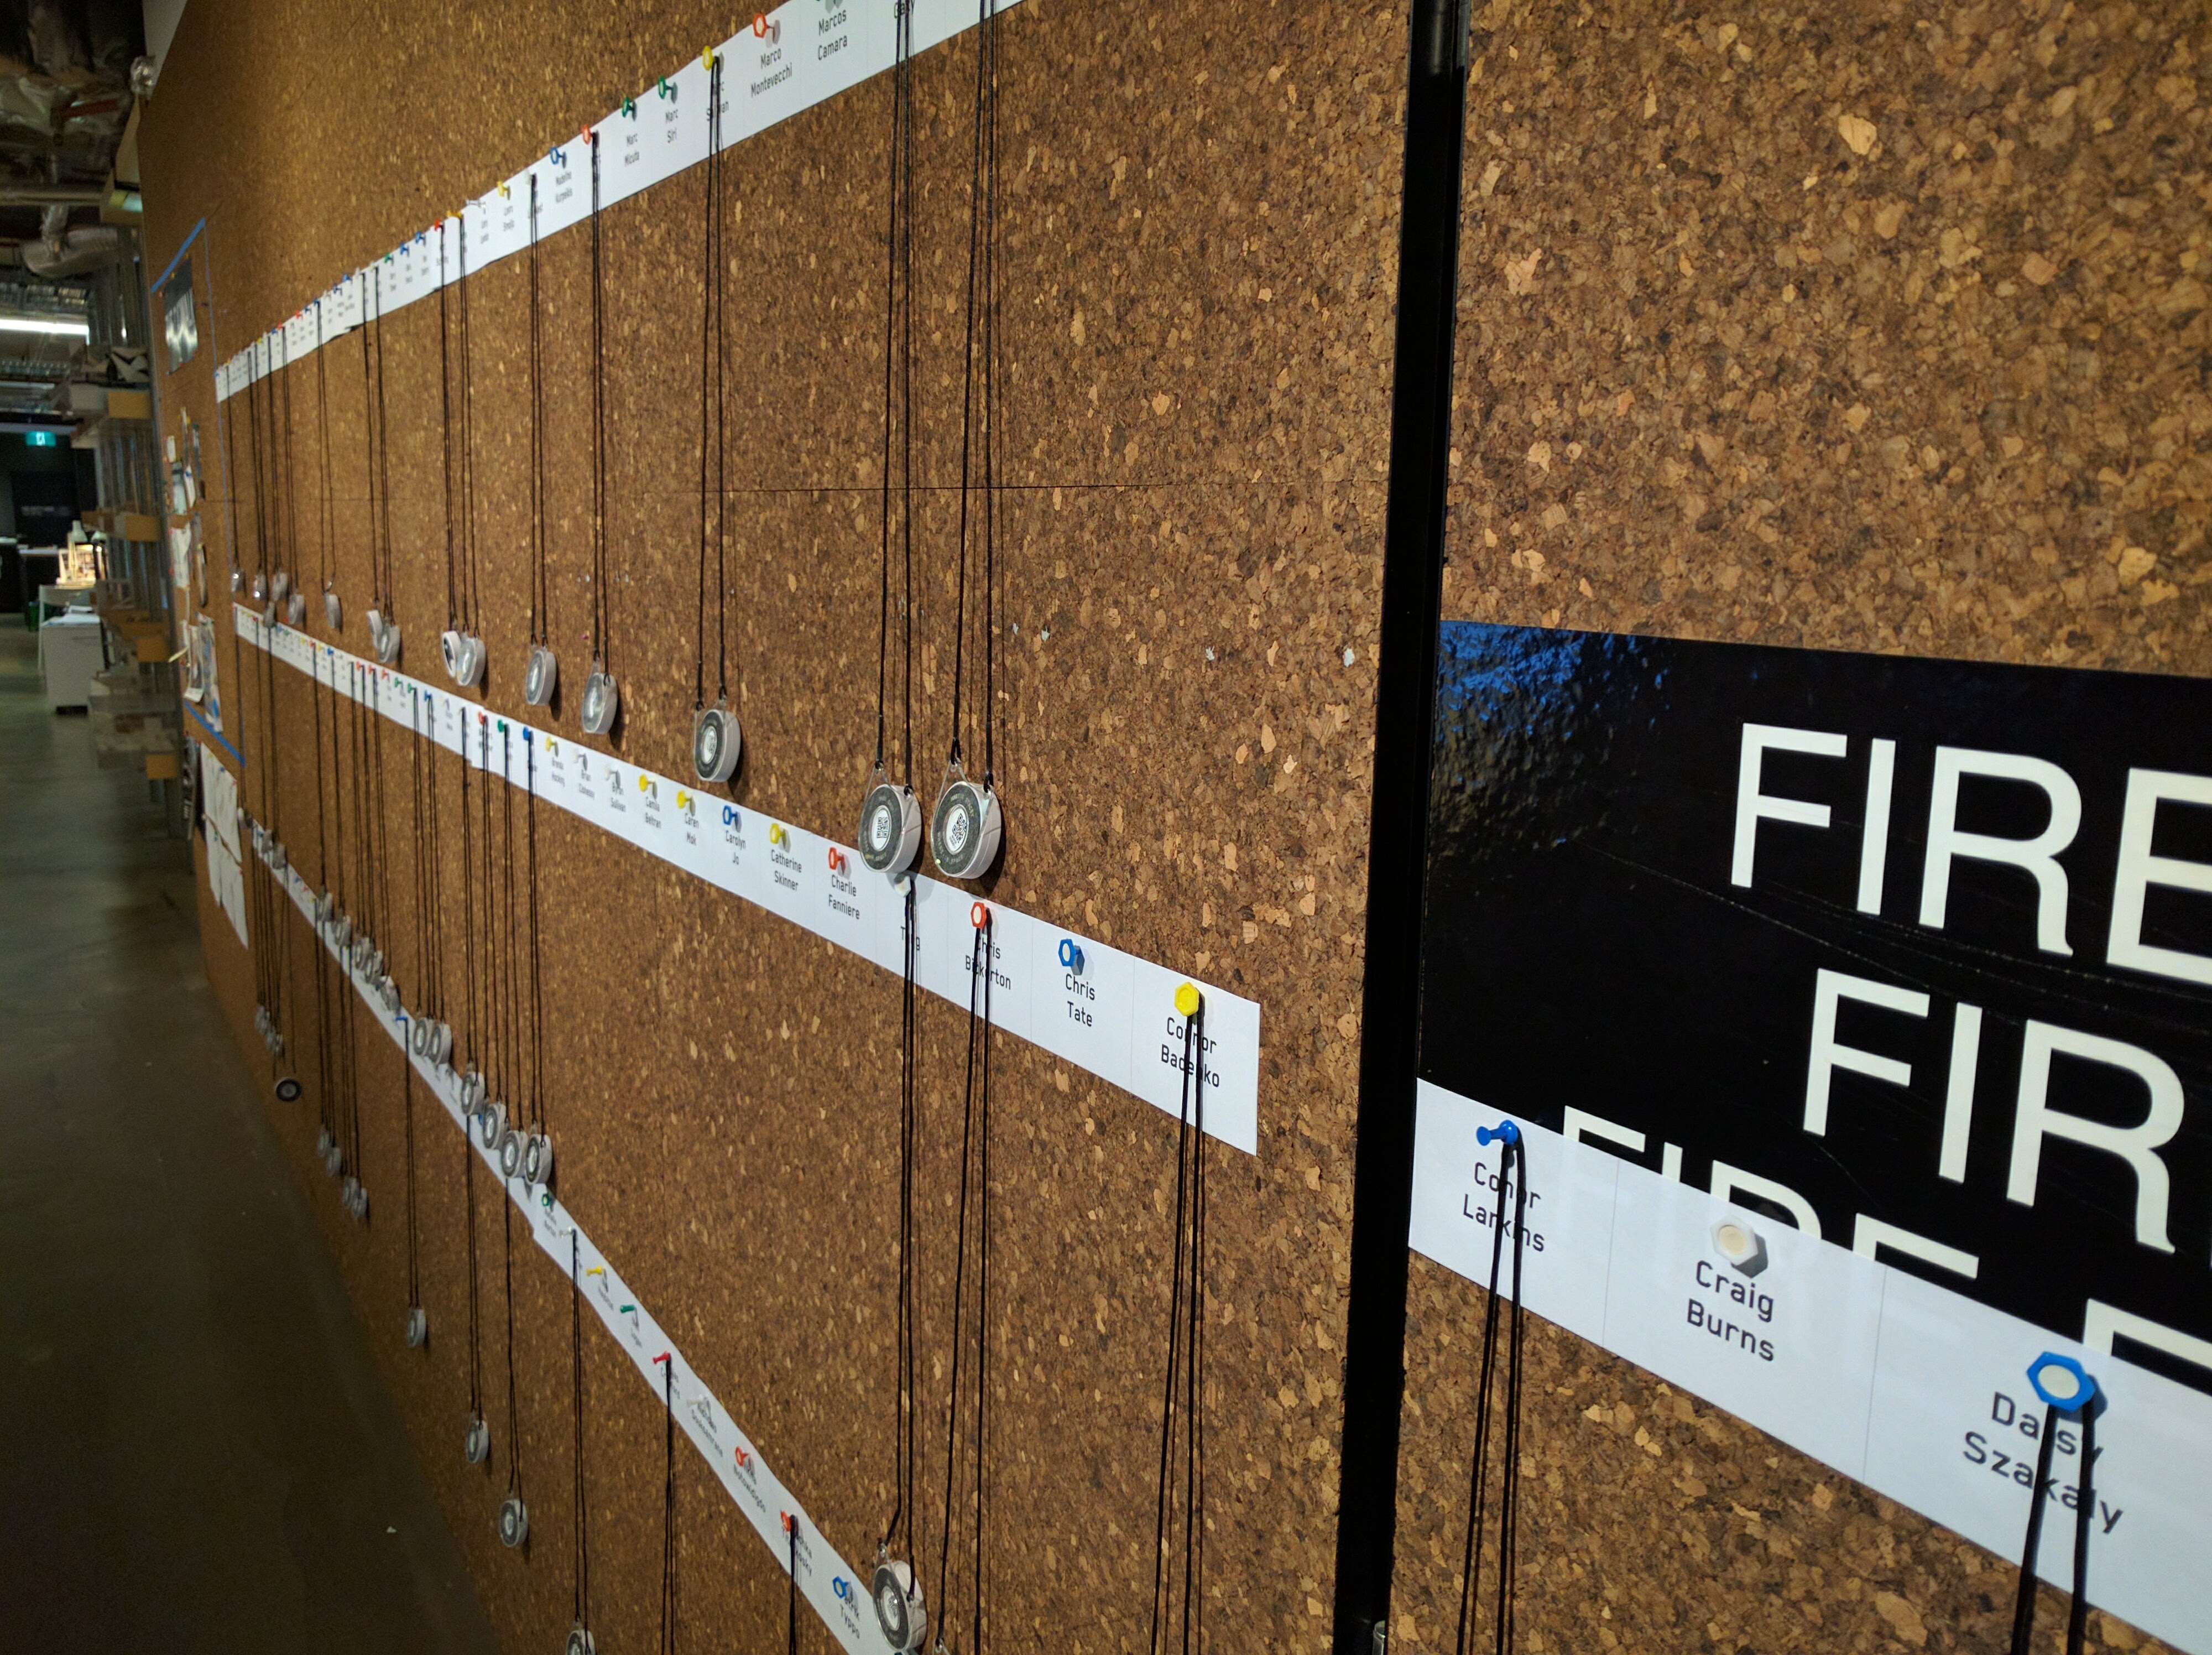
At the end of the day, put your badge on your peg on the special badge wall and off you go. In the morning, do the reverse. Keep it on all the rest of the time, then we’ll know when you go for a coffee downstairs and when you come back. I can’t stress this enough, but we don’t care about you! Obviously I care about you, but our system doesn’t. Your data are only ever part of an aggregated set. Leaving your badge at your desk to make you look more studious is just harming the data and our future ability to make great things out of it.
How does privacy work with the tracking? Or ‘The ethics post’
This is the biggest concern that people bring up; it’s completely justified! There are more ways of harvesting your data than ever and not all of them are in your best interests. Hopefully I’ll be able to convince you that what we’re doing is—at worst—ethically neutral to you. Ideally I’d like to be able to convince you that it’s actually great!
I’m not an expert in these issues so I consulted our resident expert in all issues: Mr Kirkland. He nodded solemnly and I left it with him. A couple of days later he gave me some words.
We are not collecting any personal or sensitive information.
We intend to keep the data anonymous.
We will collect and maintain the data in accordance with the Australian Privacy Principles (see Privacy fact sheet 17: Australian Privacy Principles).
The word from Ian
The data we’re collecting is an extension to the data that is already collected and held. Again, it’s important to remember that the data we hold isn’t actually about you, it’s about your badge, and without the rest of the data BVN holds it doesn’t identify you. The most useful bit of Privacy fact sheet 17: Australian Privacy Principles is 1.4, and if you want me to write a post about it then say so in the comments and I will.
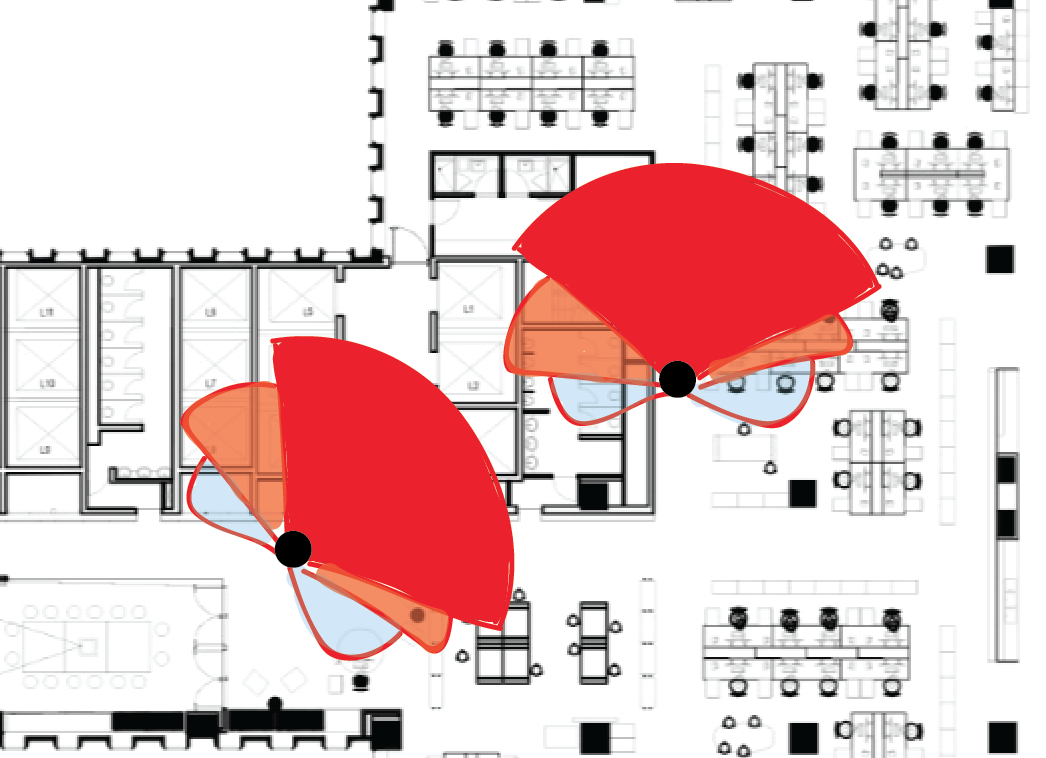
First thing to cover is what is collected, and where it goes. Your badge broadcasts a message about once a second. That message is unique to you, but it never changes; it’s not actually measuring anything about you. So no microphone or heart rate. It’s just a lighthouse sending out an invisible signal. Because the base stations are in fixed positions, when one records that message, we can infer that you are near that base station.

As you move about the different base stations will pick up your signal. From that we can infer a path.
The base station gets the message from your badge and then send it to a server.
The server is an Amazon Web Services machine. We have no idea where that computer actually is at any given time, but that doesn’t really matter. You might think that that is a bit cavalier, but let’s look at what the data look like:
![[{ "basestation": "sugar", "major": "5", "uuid": "d0d3fa86ca7645ec9bd96af400000005", "time": "2016-07-12T09:52:22.200290", "rssi": "-30", "minor": "5"},{ "basestation": "monkey", "major": "5", "uuid": "d0d3fa86ca7645ec9bd96af400000005", "time": "2016-07-12T09:52:23.159305", "rssi": "-30", "minor": "5"},{ "basestation": "golf", "major": "5", "uuid": "d0d3fa86ca7645ec9bd96af400000005", "time": "2016-07-12T09:52:24.109655", "rssi": "-31", "minor": "5"},{ "basestation": "foxtrot", "major": "5", "uuid": "d0d3fa86ca7645ec9bd96af400000005", "time": "2016-07-12T09:52:25.066845", "rssi": "-28", "minor": "5"},{ "basestation": "harry", "major": "5", "uuid": "d0d3fa86ca7645ec9bd96af400000005", "time": "2016-07-12T09:52:26.018267", "rssi": "-28", "minor": "5"},{ "basestation": "november", "major": "5", "uuid": "d0d3fa86ca7645ec9bd96af400000005", "time": "2016-07-12T09:52:26.972170", "rssi": "-30", "minor": "5"},{ "basestation": "edward", "major": "5", "uuid": "d0d3fa86ca7645ec9bd96af400000005", "time": "2016-07-12T09:52:28.886324", "rssi": "-31", "minor": "5"},{ "basestation": "queen", "major": "5", "uuid": "d0d3fa86ca7645ec9bd96af400000005", "time": "2016-07-12T09:52:29.845437", "rssi": "-31", "minor": "5"},{ "basestation": "romeo", "major": "5", "uuid": "d0d3fa86ca7645ec9bd96af400000005", "time": "2016-07-12T09:52:31.753674", "rssi": "-28", "minor": "5"},{ "basestation": "pip", "major": "5", "uuid": "d0d3fa86ca7645ec9bd96af400000005", "time": "2016-07-12T09:52:32.709790", "rssi": "-28", "minor": "5"}]](/assets/16/trackingPostImages/data.png)
This is a tiny snippet of the data. We’re actually producing a few gigabytes a day. To read it, think of it as pairs. They key is on the left, e.g. “base station” and the value is on the right e.g. “monkey”.
Separation of data holding
That data chunk is pretty meaningless! It’s almost useless to anyone without quite a lot more information needed to decode it. Most of that information lives inside the BVN Data Fortress. So we can see that the data associates a person (UUID or Universal Unique IDentifier, e.g. d0d3fa86ca7645ec9bd96af400000005) with a base station (e.g. sugar, monkey or golf) and a time. To unlock this information you need to know the layout of the base stations and the mapping between UUIDs and names.
We, the experimental team, will have access to the layout of the base stations. In fact, here it is in case you were wondering too:
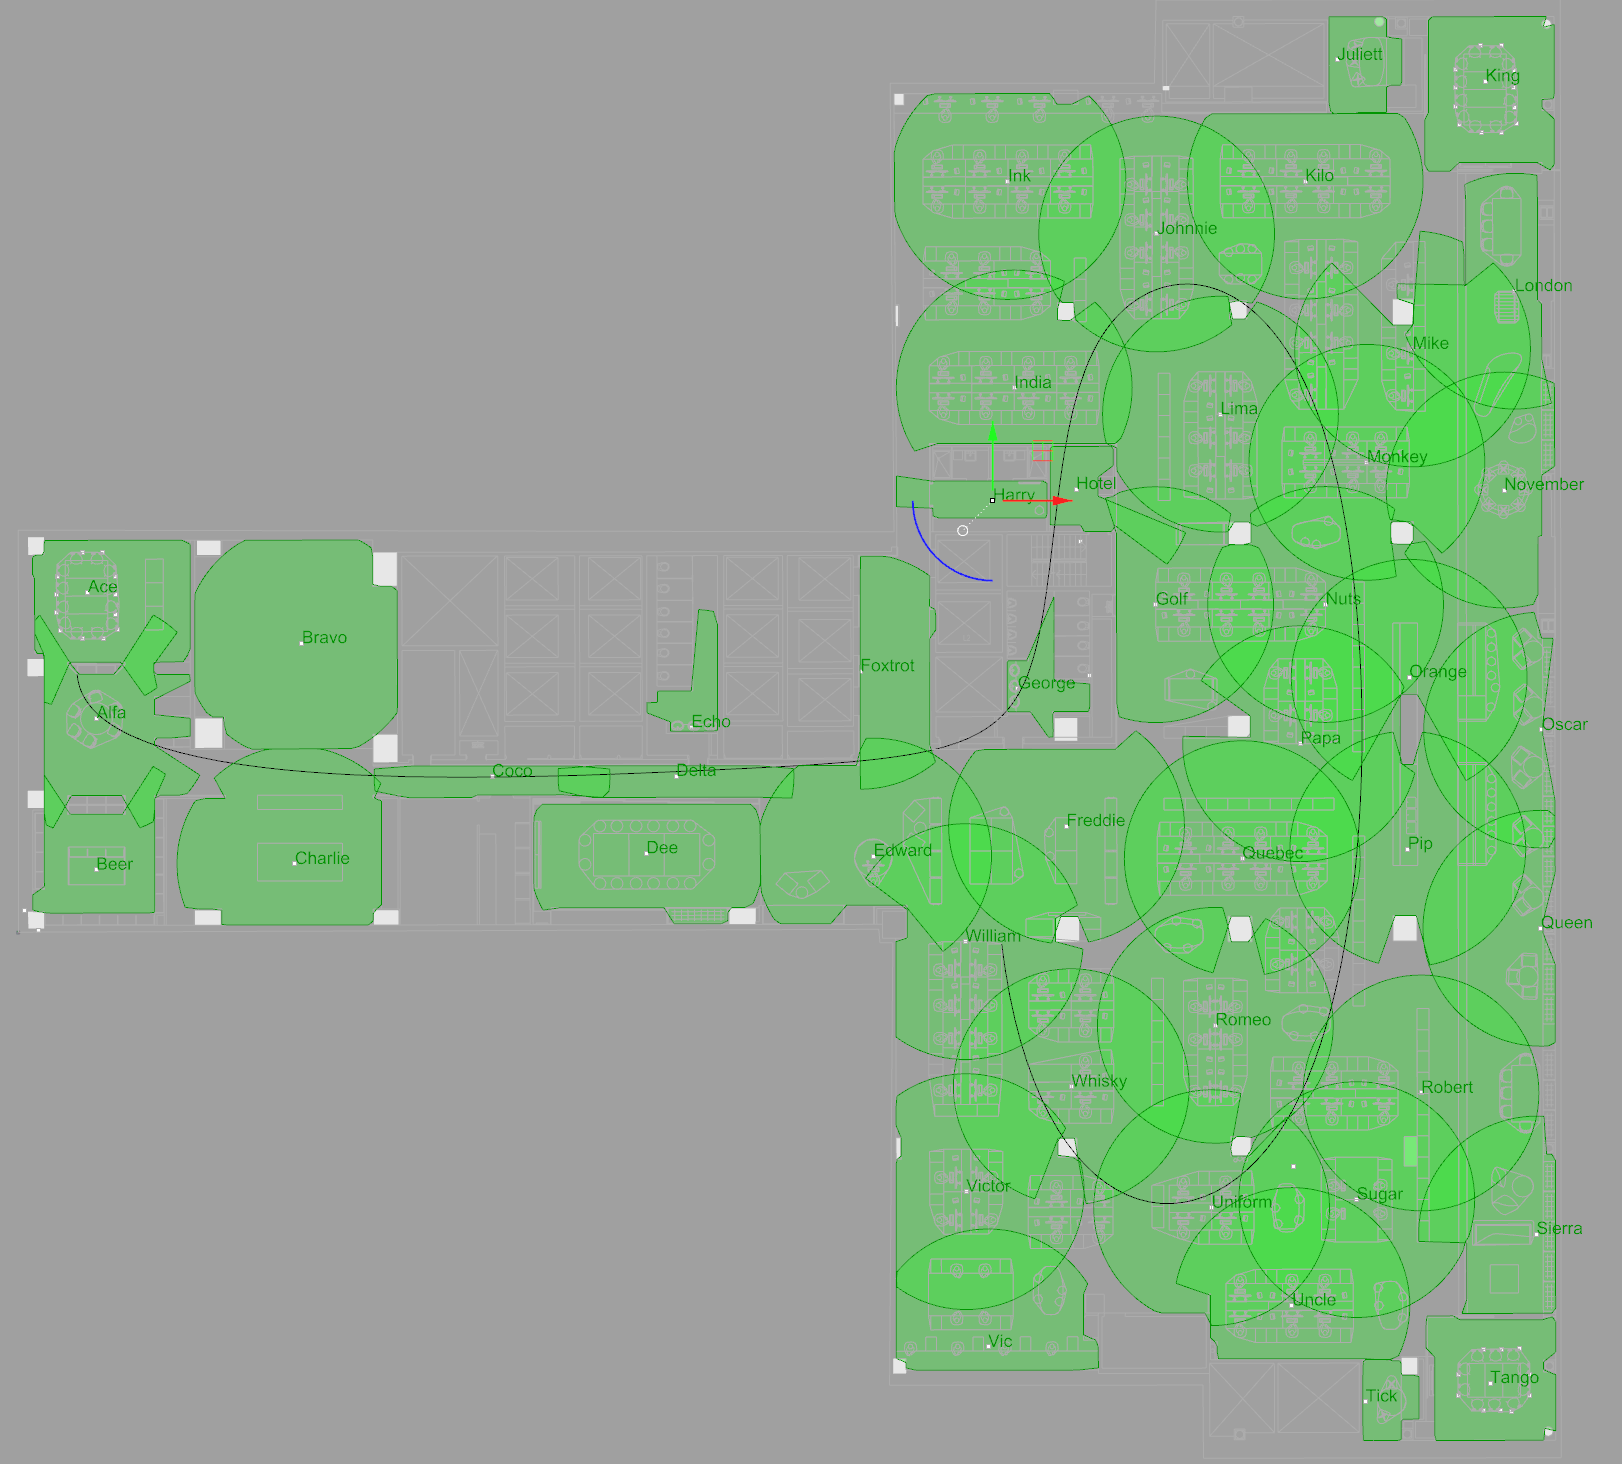
BVN Sydney’s studio with the base station layouts overlaid. The circles (actually isovists) show the expected range of each base. TODO: replace this with new map.
We, the experimental team, don’t have access to the person data. We will eventually have access to some attributes about the people so we can see if they are correlated with movement trends. E.g. do old males move differently to young females? This is a bit of a silly example, and we’ll talk more about this kind of work in the future when we get to it, but I think it gets the point across[1. I remember a story that said Cervélo (bike company) did some research into the received wisdom of ergonomics. Tradition held that women had longer legs and shorter bodies compared to men. They found that tall people had longer bodies and shorter legs. Because most women are in the group of short humans the previous analysts chose sex as the line to cut along.].
Ethics application for new uses
There are a few main models for getting data.
The classic scientific model is to form a hypothesis, then work out how to get the data to support or disprove it. This is great, and almost everything that makes your life comfortable today is thanks to this method.
The more modern way is to just grab everything you can. Storage is really cheap! At some point in the future you might need to dip into that pool of data to answer a question. This is the kind of thing that Google and Amazon do. Government agencies like the NSA also do this kind of thing. While they are famous for being sketchy and doing illegal things, they do have a proper way to do things. (Even if sometimes they don’t use it.)
The method the cops use to get to your phone records to see if you really are drug dealer is the same as the process the NSA would use. They apply to a judge for a warrant. We’re [probably] going to use that model. We’ll have a lot of data, and in order to get access to it anyone can go through a review panel. That panel will decide if anyone would be harmed by the applicant having access to that information.
What will these data be used for?
These data will become tools that help designers and brief writers understand their target audience better. This might be:
- reports with diagrams and animations,
- it might be specialist ways of answering questions that we’ve never been able to answer before,
- or it might be a simulation so that we can test a space for a few hundred virtual-years before we really build it.
These are a bit vague, but I’ll go into more detail in another post.
One of the reasons that I’m so keen to keep any extra information about the people we are tracking is to avoid what’s been called “Artificial Intelligence’s White Guy Problem”. Machine learning algorythms are usually trained on pre-classified data sets. If there’s bias in there to start with then that bakes bias into the resulting classifier. Unpacking that a bit, imagine we design an office for a fashion retailer like Sportsgirl. If we used the data from measuring a construction company like Buildcorp then the results from a simulation would be misleading.
Milton Waddams wants his stapler back. Just as an aside, you really should watch office space.
What won’t we use these data for?
This is the really important question! The vital thing to me is that this system is never used as a force for harm. It will never be used to identify an individual without their explicit permission. You will never be judged for not giving permission either. I’m going to use my own data in presentations, I have the say over my own data. Once we make a portal you will be able to use yours too. Nobody will be able to find out anything about you without your say so.
This means that it won’t be used for hiring and firing, or promotions, or choosing what project you’ll be on next etc. The key idea here is aggregation. We still haven’t worked out the technical specifics of it as a system, but you won’t be able to get data on anything bigger than a group level. An example of that would be all interior designers or all females. You wouldn’t be able to compound these until you only got one person so all males who are bald and English and called Ben would be a definite no.
Summary
So to go over the important things:
- Data specifically about you can’t be seen by anyone except you.
- The information about you is stored in a BVN database, separately to the data about your movements.
I actually really care about this stuff, so I’m going to work really hard to make sure that the data we gather is used responsibly. I’ve been really shallow in this post (and it’s already over a thousand words) so if you have any questions then go crazy in the comments or come and see me.
What’s these things? Are the Daleks coming? Or ‘The why post’
These are both good questions! The answer to the first one is going to take a while to explain, the answer to the second is easy: no Daleks.
The quick answer is that they are sensor pods, but the more interesting question is why. There is a real chance that this will just become a series of recursive ‘why’ questions. If you don’t have patience for that, here’s the presentation I gave on Friday:
This is my slide deck, but it’s just animated gifs of cats and dancing robots, so reading this is the best way to understand.
Why are we doing this experiment?
Here it all is in textual form. There are a lot of reasons, here’s a few of them:
-
Wouldn’t it be nice if we had numbers, then we wouldn’t have to make things up…
The Monkees know what I mean!
We usually don’t have any way to back up our arguments other than experience. Experience is incredibly valuable, but experience + numbers is much more persuasive. The closest thing we have to a quantitative answer to how effective bump-spaces are is this image:
[TODO: long exposure sovereign bump image]
Here it is! Our most compelling bit of data so far.
Most designers are potently charismatic in front of clients, we’re good at that. Often decisions get made one degree removed from the presentation. Charisma isn’t portable, but evidence is!
Not so good if the decisions are being made without Obi Wan there.
-
Current POE (Post Occupancy Analysis) methodology is really broken. Just ask anyone who’s had to be the clipboard person in an observation study.
POE methodology was mostly invented by well intentioned, pre-technology hippies. It’s mostly founded on myth that if you ask someone a question they will tell you the truth. We now have extensive research that shows that people are terrible at telling the truth, even to themselves. (For a quick way to get up to speed on this domain read Kahneman’s excellent book Thinking Fast and Slow.) This is compounded by the problem that people change their behaviour if they see an observer. All in all, most POE data is a bit spurious!
-
Business model innovation!
We currently play a waiting game. Clients decide when they want to make a change to their building. This might not actually be at the best time for their business goals because they probably need the new space at the time that they identify a problem. Then they need to go through all the briefing, design, building, moving out, moving in etc. We could offer a spatial-health monitoring service of some sort. We can do some predictive analytics to get clients to start thinking about these things so that they are ready just at the right time.
-
There is academic interest in how people move in non-goal-directed situations.
-
We can use the data to train simulations.
We can have virtual people testing our intuitions about how they’ll use the space. Probably not in this much detail yet.
It enables AI testing with simulated people. Those simulated people can have reality based personas, rather than just assuming that all people behave the same way. In other words we can see what happens when you make a simulation with 40% millennials, 40% gen Xs and 20% boomers. At the moment we need to treat all people as the same.
-
New consulting opportunities.
We understand space, and mostly we try to solve problems by making spatial interventions. That’s the case because our current business model is set up to do that. What if we could use our understanding of space, augmented by extra data, to propose other interventions? We can search for correlation between behaviour and business goals. Finding out what high performance teams do that low performance teams don’t.
How it works
The technical term for the class of things that this is one of is Indoor positioning system. We’re not currently using it as one, and we’re not using the standard way of doing things, so internet-reading about this might be a bit confusing.
This is a badge:
and this is a base station:
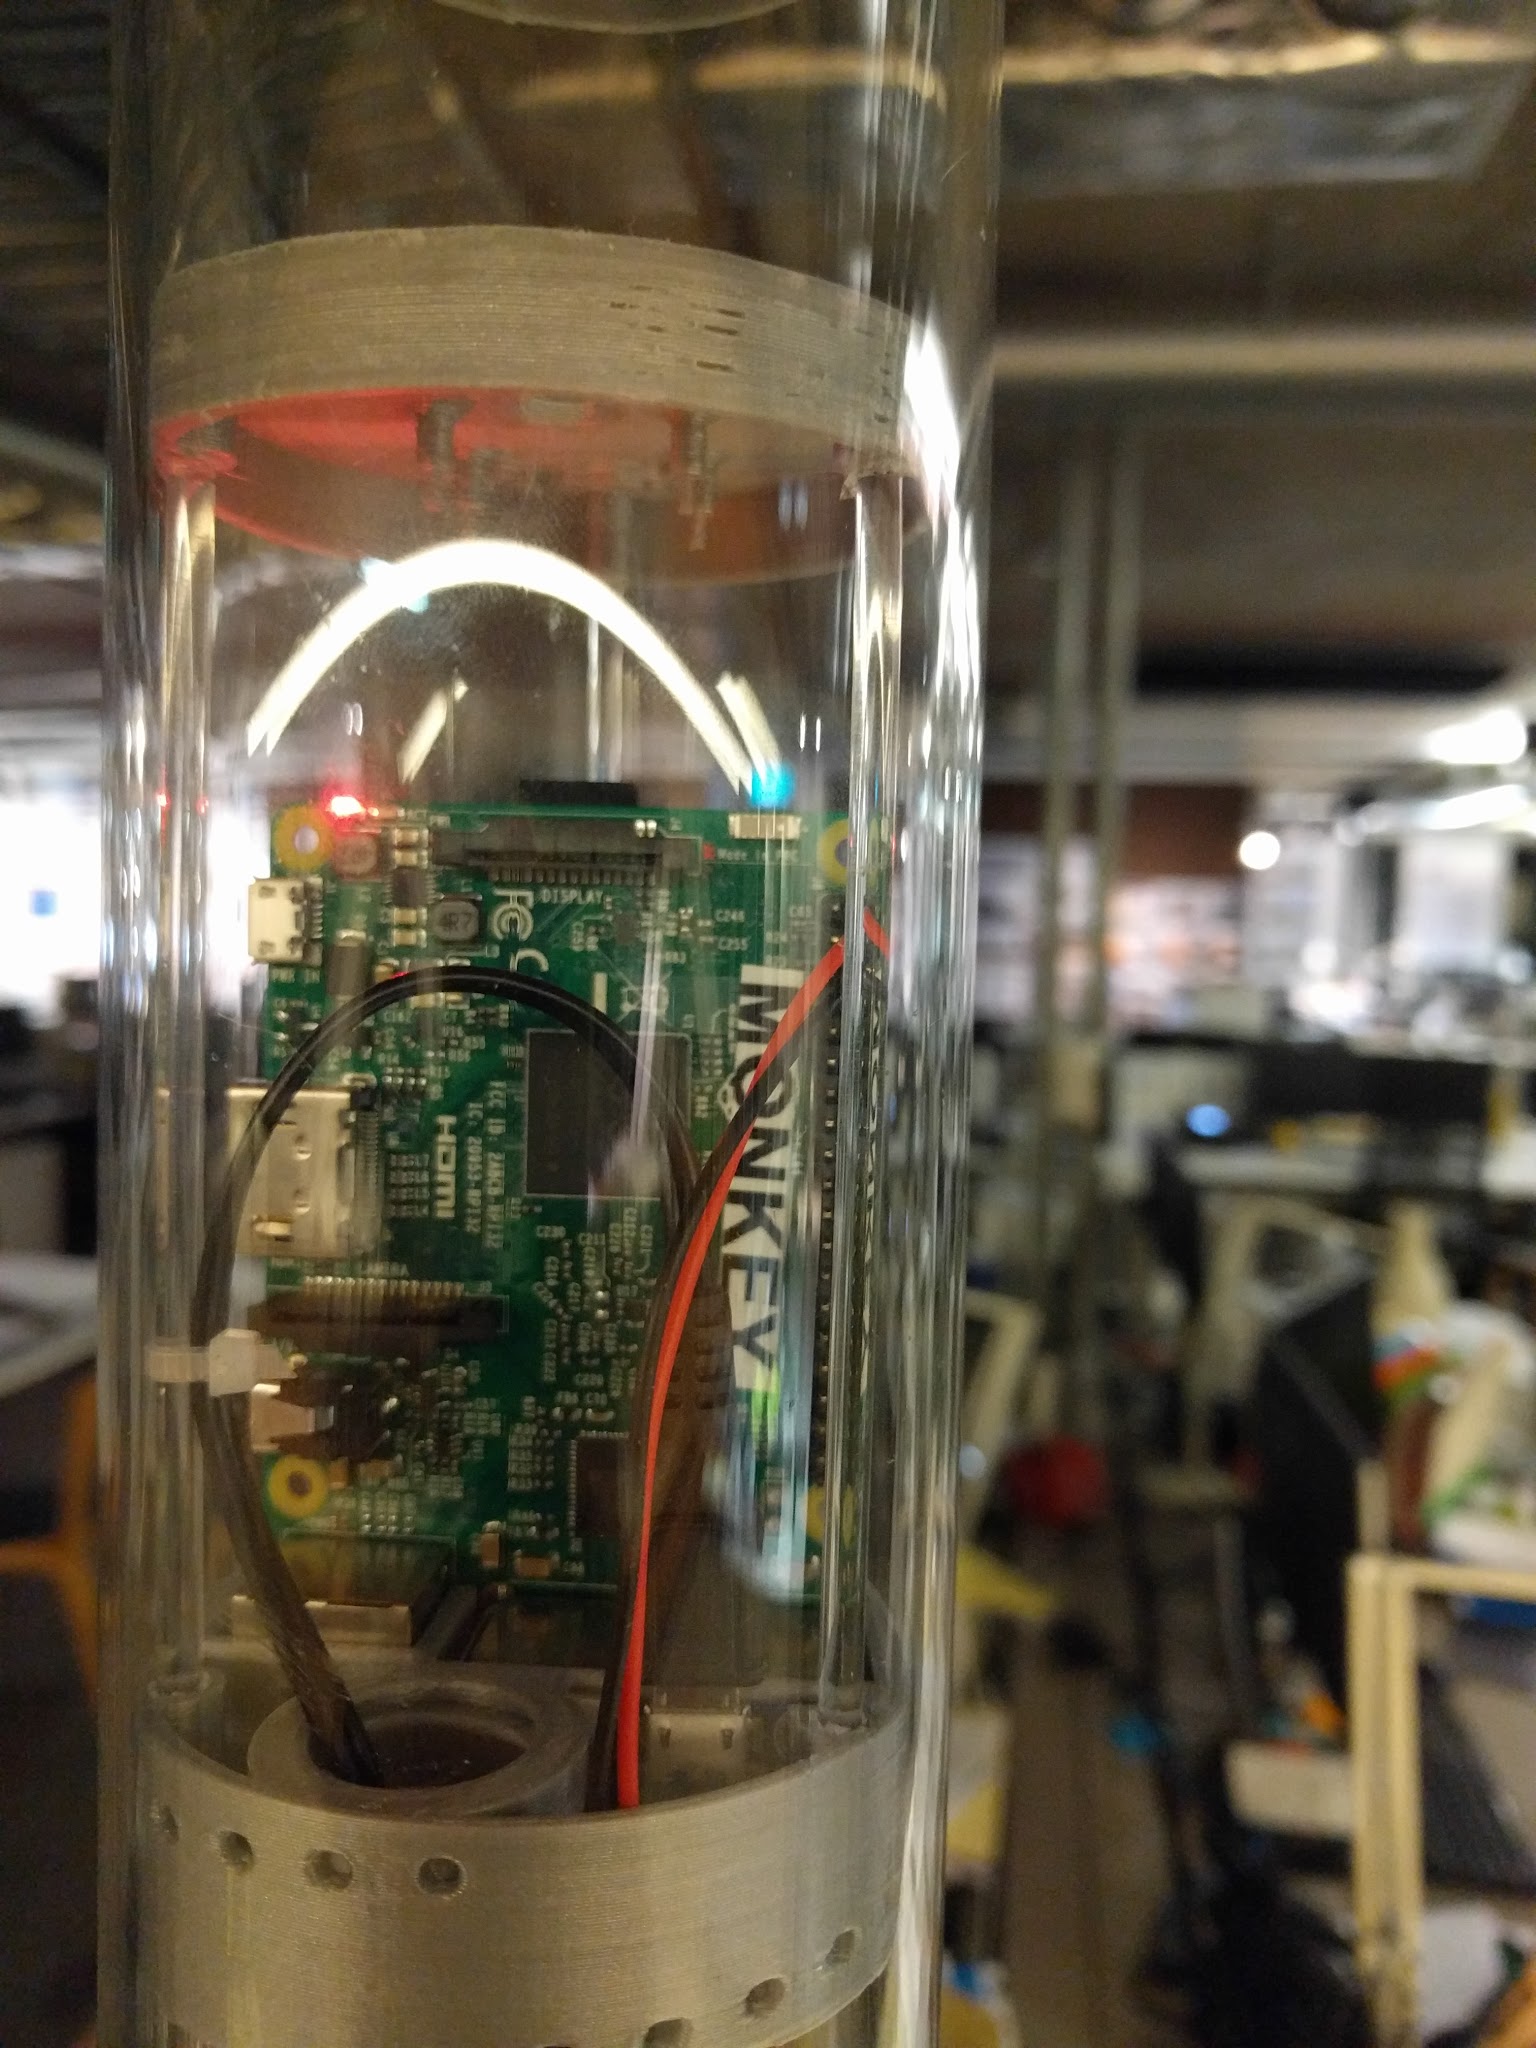
This one is called Monkey, say “hello monkey”.
Like most important topics in this post, there is another post about how this all actually works in detail. Here’s a broad overview.
-
Everyone wears a badge. That badge broadcasts a fixed message, which is a bit like a light flashing a pattern unique to each badge.
-
A base station picks up that signal. The base stations are in known locations.
-
The base station sends all the detections it makes to a server.
-
The server puts it all into a database.
That’s the data recording process. To get the data out we use database queries to pick out specific things. E.g. tell me how many people were detected by the lifts on Tuesday before 1pm.
I wasn’t going to talk about this but lots of people have asked. BLE uses 0.01 to 0.5 W, a mobile phone on a 3g connection uses 1.73W. That’s between 35 and 173 times more powerful. I’m not an expert in mobile phones and cancer links (as far as I can tell, nobody actually is) but that’s enough of a reduction that I’m not concerned about it.
That’s a high level view—like from the moon—so read this post for more detail.
Important things
The most important thing to remember is that this is an experiment we don’t know that it’ll work. (I feel pretty confident, but certainty is for suckers.)
This experiment relies on everyone participating. It’s about creating a dataset that we can use to gain understanding. If you aren’t wearing your badge then it will diminish the quality of data we collect about other people. I call this the “having a conversation with a wall” problem.
Privacy is a really important concern for this, so I’ve written a whole other post about it.
Sensor Roadmap
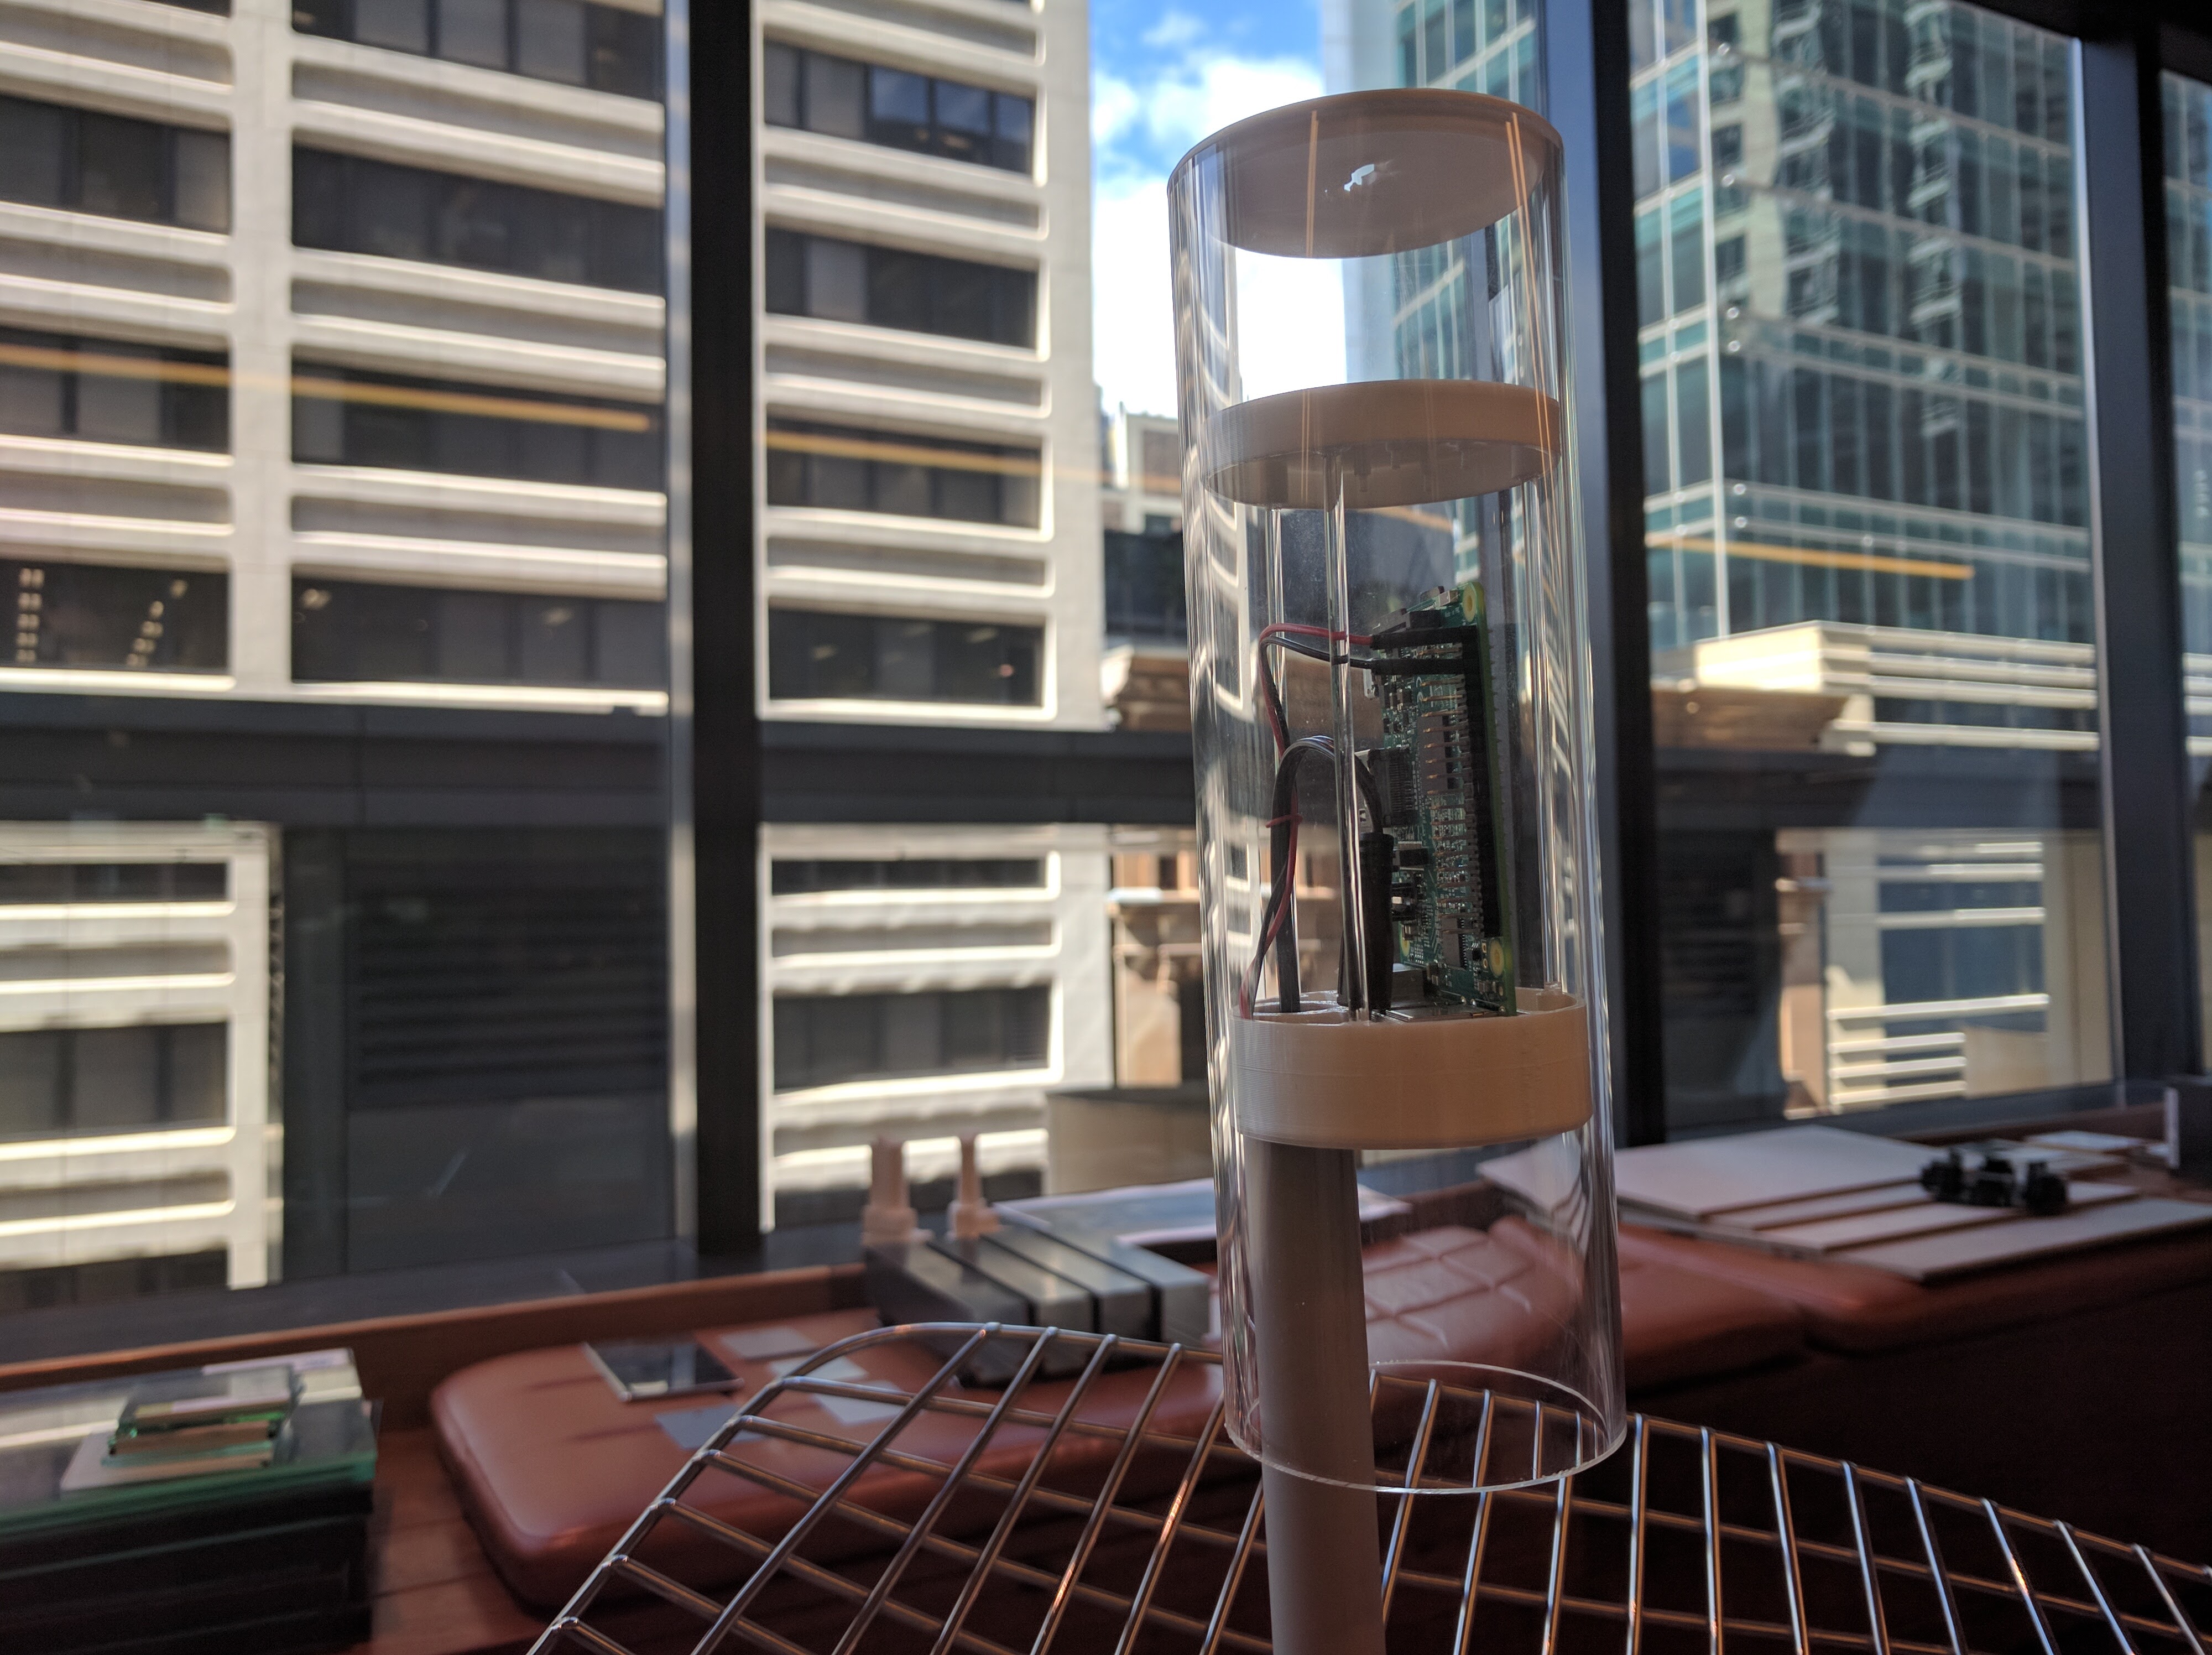
Our very first full prototype. Born on the 1st of September at 12:17pm. Weighing a couple of hundred grams and 225mm long. We’re very proud.
Getting the bases in place and making sure that everyone has a badge is only the first step in a long process. We need to turn the investment in hardware into tangible value. There are three main prongs of this process, and they are all intertwined: Hardware, Software and Market. Each of them informs and relies on the others.
What we do in the long term is a mystery, but here’s how we’re planning to progress in the near future. I’m not going to talk about market here, but I will in a future post.
Installation
Now that all the bases are installed and badges are being worn, there’ll be a period of trouble shooting. This is an experimental system so there are likely to be some teething problems. Once we have them worked out the first job is to train the system to turn the detection data into locations and paths. This might be straightforward, but until we see what it’s really like we can’t know. Our simulated data can’t be as complex as reality, so I’ve got everything crossed that this will be easy. (We have some fine minds on the problem, so as long as I stay out of the way I’m not too concerned!)
Hardware
The next stage is to upgrade the hardware. The current capability is just detecting when a badge is nearby. We want to add more sensing capability so that we can tell how the environment affects the way people move.
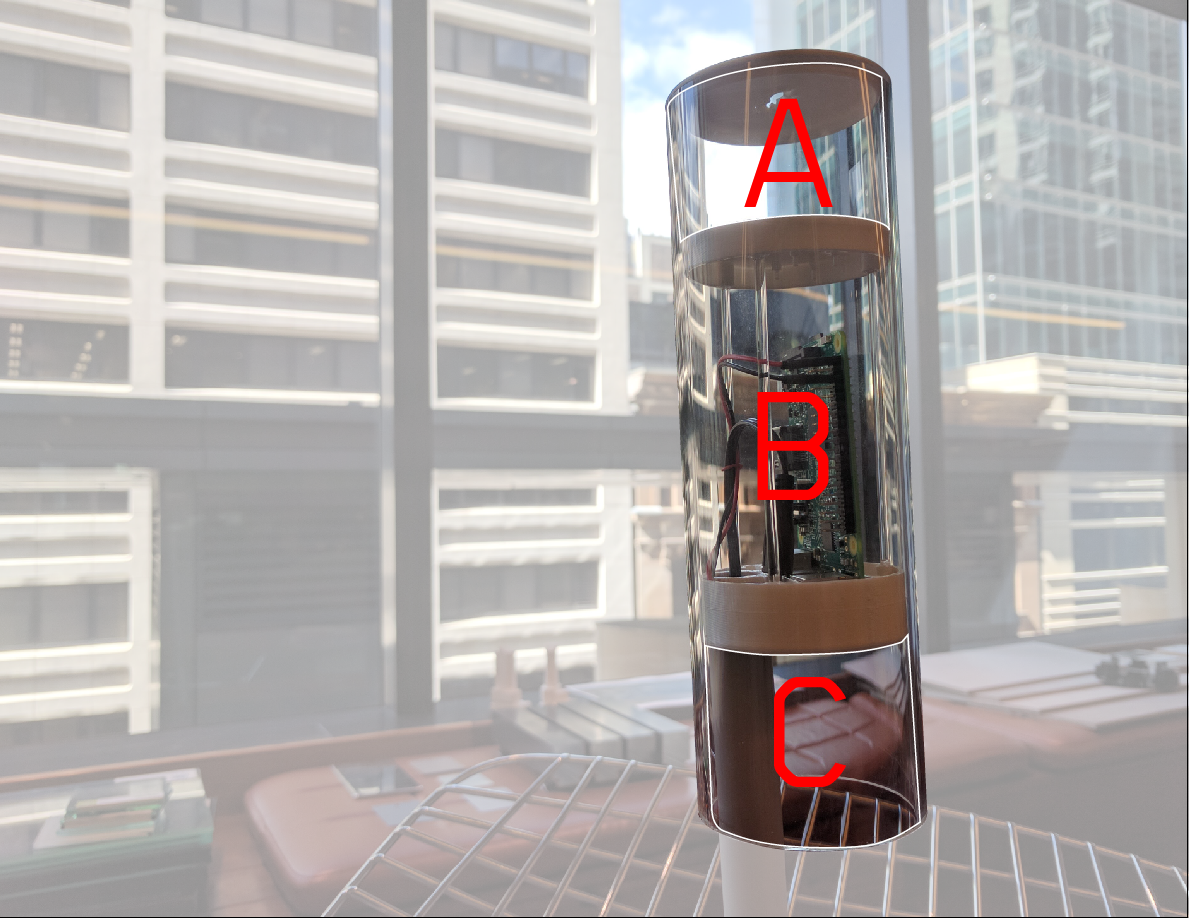
The three compartments do different things.
In the image above, section B is where the brain lives; this is a Raspberry Pi 3. It does all the processing and network communication that we need. It’s probably huge overkill for what we’re asking it to do, but it gives us a lot of future expansion options[1. In future versions it might well change to being a Pi Zero which is much smaller and cheaper.].
Section C is open to the air, it’s going to have environmental sensors in it. We’ll be measuring temperature, humidity, noise levels and maybe air movement. If you can think of anything else that we should be measuring then let us know.
Section A answers all the people who were thinking “It’s horribly dark at my desk, why aren’t you measuring light levels?” We’re trying to be a bit smart about this. Light levels need to be measured in a particular place, so using a light sensor will only tell us what it’s like where the light sensor is. We’re going to use a camera; it’s like the equivalent of using 8 million[1. 3280 x 2464 = 8081920 pixels. Obviously they aren’t all going to be useful, but it’s a lot more specific than we can get with light sensors.] light sensors.
By facing the camera at a parabolic reflector we can see a cylindrical image. Here’s an example of someone doing it with a Christmas bauble:
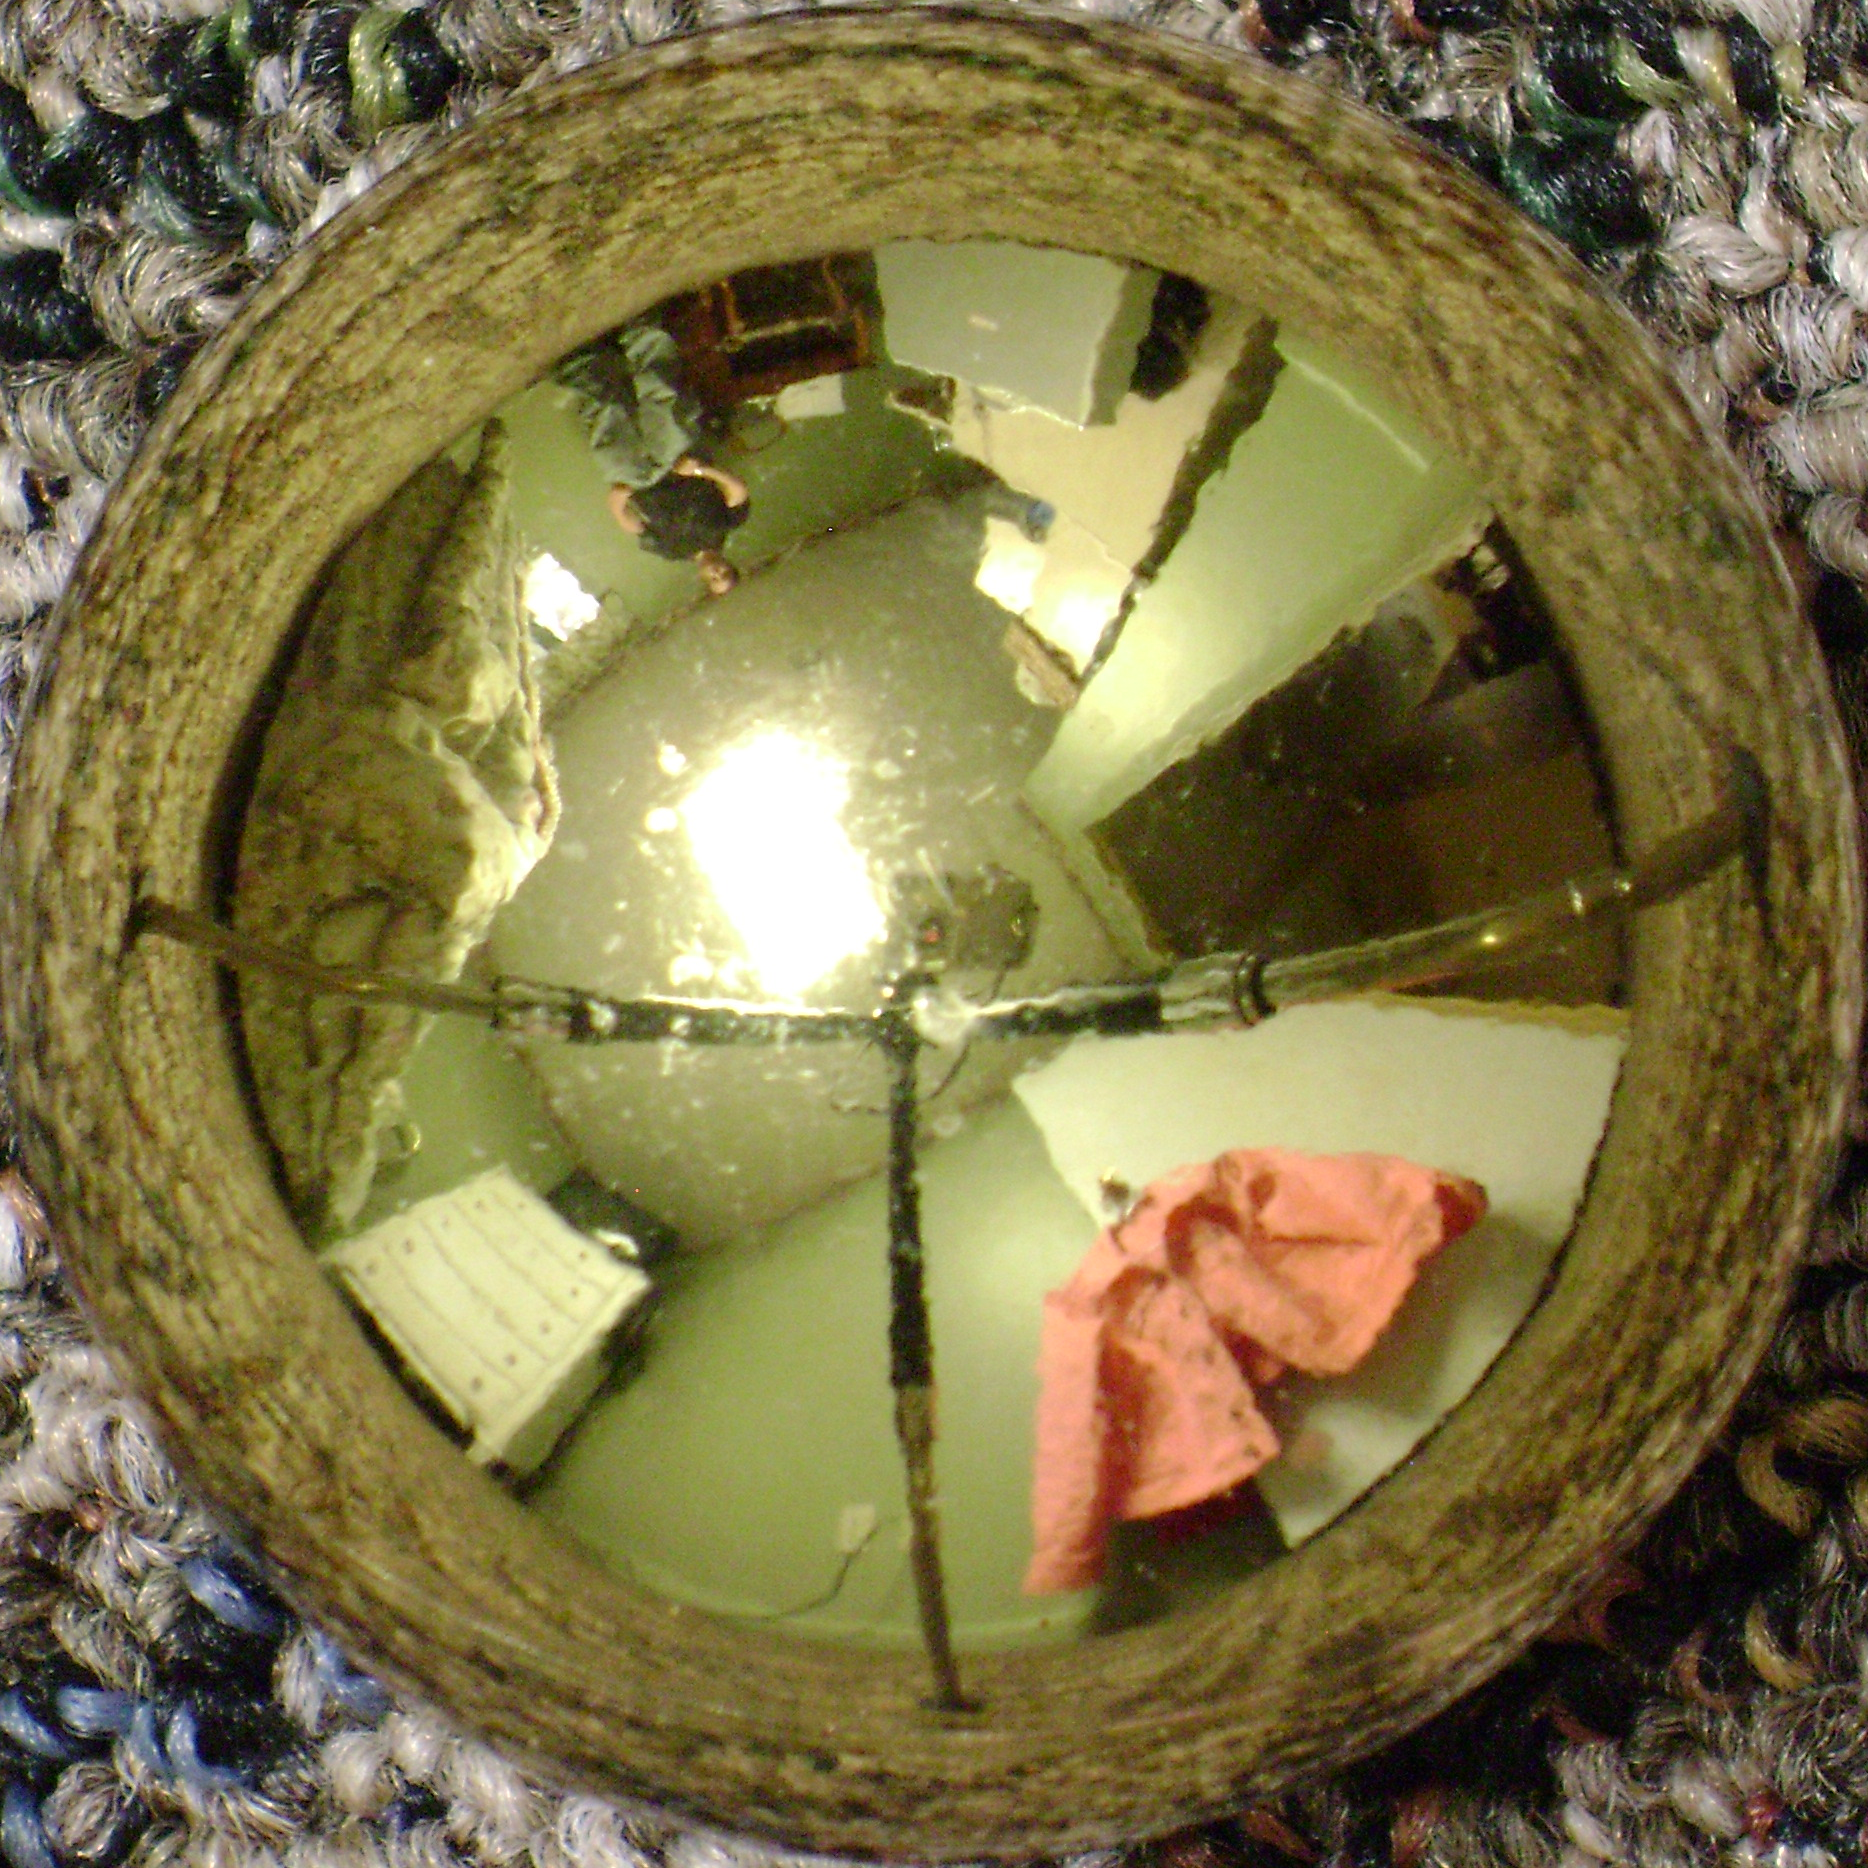
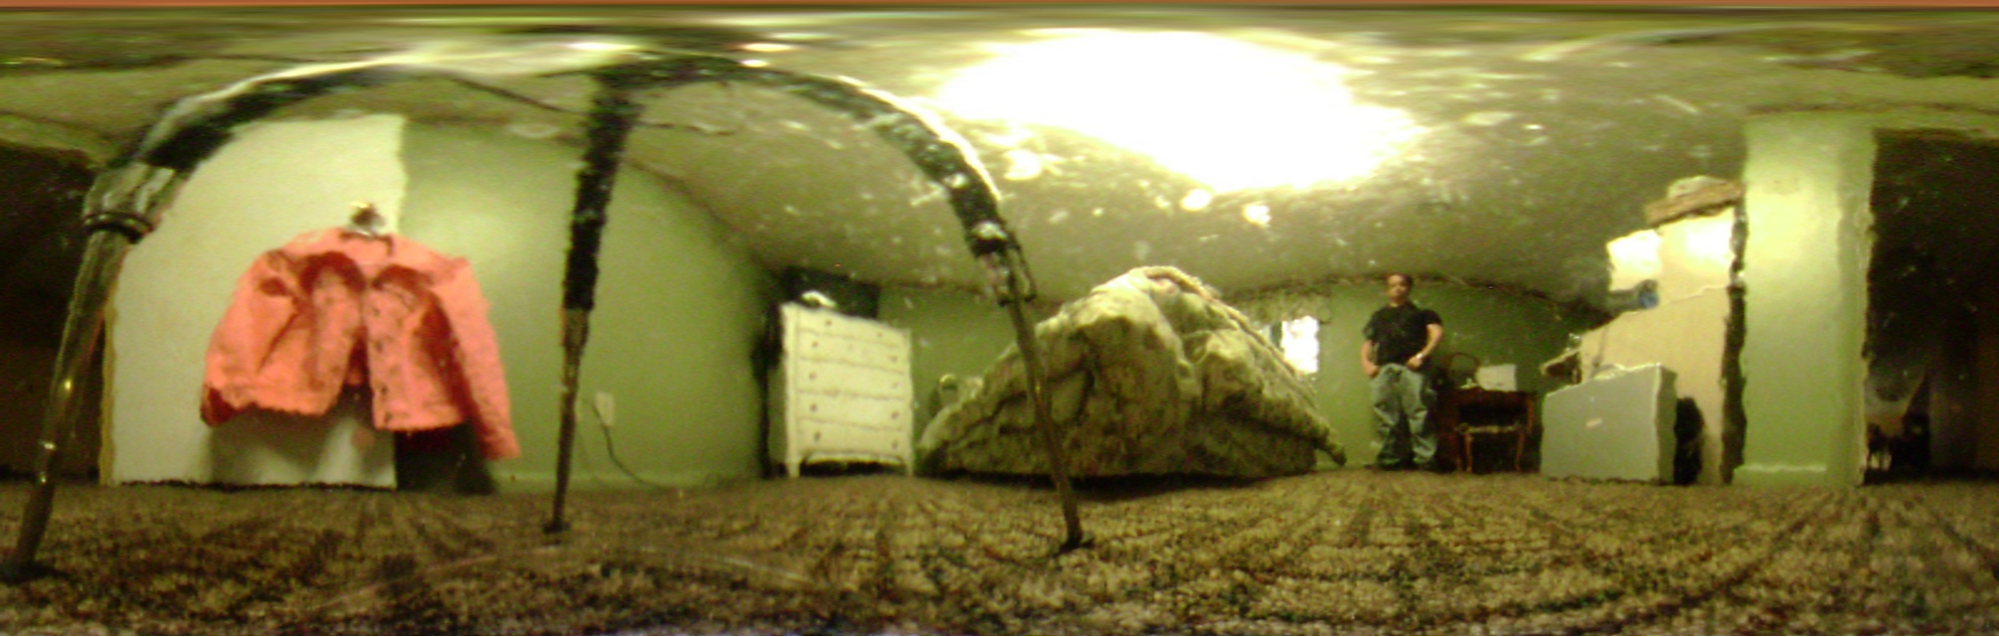
The top image is a normal photograph of a spherical bauble. The bottom image is that photo unwrapped using a transform—something like ImageMagik’s sfisheye2pano
We’ve done some virtual prototypes that show it should all work, but it’s going to need some real life testing.
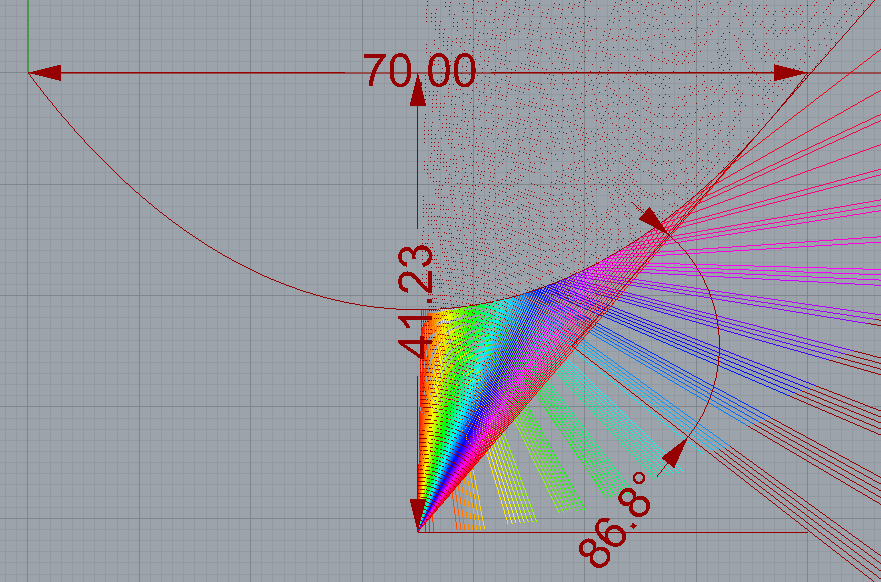
The virtual prototype shows us that a shallow parabolic dome is the most efficient shape to get a really good panorama.
Once we have a cylindrical image, we can process it into numbers.

This is all fake, but it makes the same point. If this were real it’d produce a 40 × 100 (ish) grid of numbers, and that’s all we’d keep.
Here it’s subsampling the image and then assigning a brightness value to each section. We can do this as a grid, or as stripes, whatever ends up being most useful. Once we have this data we throw away the image. By storing only the metadata we can’t go back and spy on anyone, and it reduces our storage overhead a lot too!
Software
Once we have our exciting and capable hardware we’ll want to develop software that makes use of it. This system is agnostic about its end use, so this stage will be about building custom use cases for it. For example, Kevin might want data to support Project Good Project, or Domino might want data on interaction potential for a conference presentation.
After that…
So that’s what the next little while holds for the ‘easy’ bit of working out how to do things. The stage after that will need some input from the market end of things. It will probably involve considerable miniaturisation and ‘value engineering’ of the hardware. There will be ongoing software work to refine the accuracy and the usefulness of it all.
Tell me about the theory behind the experiment and why are there sensors in the toilets? Or ‘The nerd post’
This has been a bit of a divisive issue, but it’s important, so I’m going to try to explain why we decided what we did. The answer is going to go into quite a lot of technical details. Here’s an executive summary that gets the gist across, but I’d encourage you to persevere through the rest of it.
“Please, speak as you might to a young child… or a golden retriever.” Jeremy Irons—what a boss!
Executive Summary (Tl;dr:)
One of the uses for the data collected by this experiment will be to train a simulation. Generally this is a list of states and probabilities of changing state. In our case, states are defined spatially, like in the kitchen, in a meeting room or at my desk. In any given minute, what is the likelihood that I will switch state?
We need to know when people visit the major attractor points in the office, and toilets are one of them.
Details
Here’s that summary, but in much more detail:
What is a statistical model?
As the data change, so does the line of best fit. That line is a model that has predictive power.
I often wish that this was a satirical model or even a sadistic motel, but alas not this time. A statistical model is some kind of function that given a set of initial conditions, tries to predict a future condition. An example would be something like:
What temperature will it be tomorrow?
A good model to work that out would be
Tomorrow’s temperature will be the same as today’s.
That’s obviously not perfect, but it’s actually pretty good. If you ever did fitting a line to a scatter plot in school then you were making a statistical model[1. In fact, almost all the magic in statistics is about making your data fit a straight line (log transforms etc.).].
Things can get a lot more complicated than linear regression though. Artificial intelligence and deep learning are also statistical models. They are just a lot more fashionable.
One way to describe what a statistical model is is to say what it isn’t. A model described by a function[1. You’d read as a function that adds to , whatever is. So becomes and so on.] is completely deterministic. Statistical models have some uncertainty to them[1. Disclaimer: I’ve simplified this as much as I can, I’ve probably allowed some inaccuracy to creep in. I wouldn’t quote me on the above explanation, but if you want to know more, follow the links.].
What is a state machine
A state machine is a way of describing a bit of the world. It’s not an actual machine like a coffee machine or a sewing machine is, it’s purely abstract.
This site has some great interactive tools for learning about them and getting an intuition about how they work.
The state machine describes what is possible, regardless of how probable. So in thinking about ourselves in this office then the list of states might be:
Here’s a state machine diagram that shows all the possible state transitions. You can drag the bits about to see how they link up. It isn’t all that useful to know that you can go from the shower to your desk if you never do. That’s the next step!
(It doesn’t show state changes back to self, but you can just imagine them.)
In our case, it’s possible to go from any of these states to another one. That doesn’t tell us much. It gets much more useful when you put probabilities on those state transitions.
What is a Markov chain?
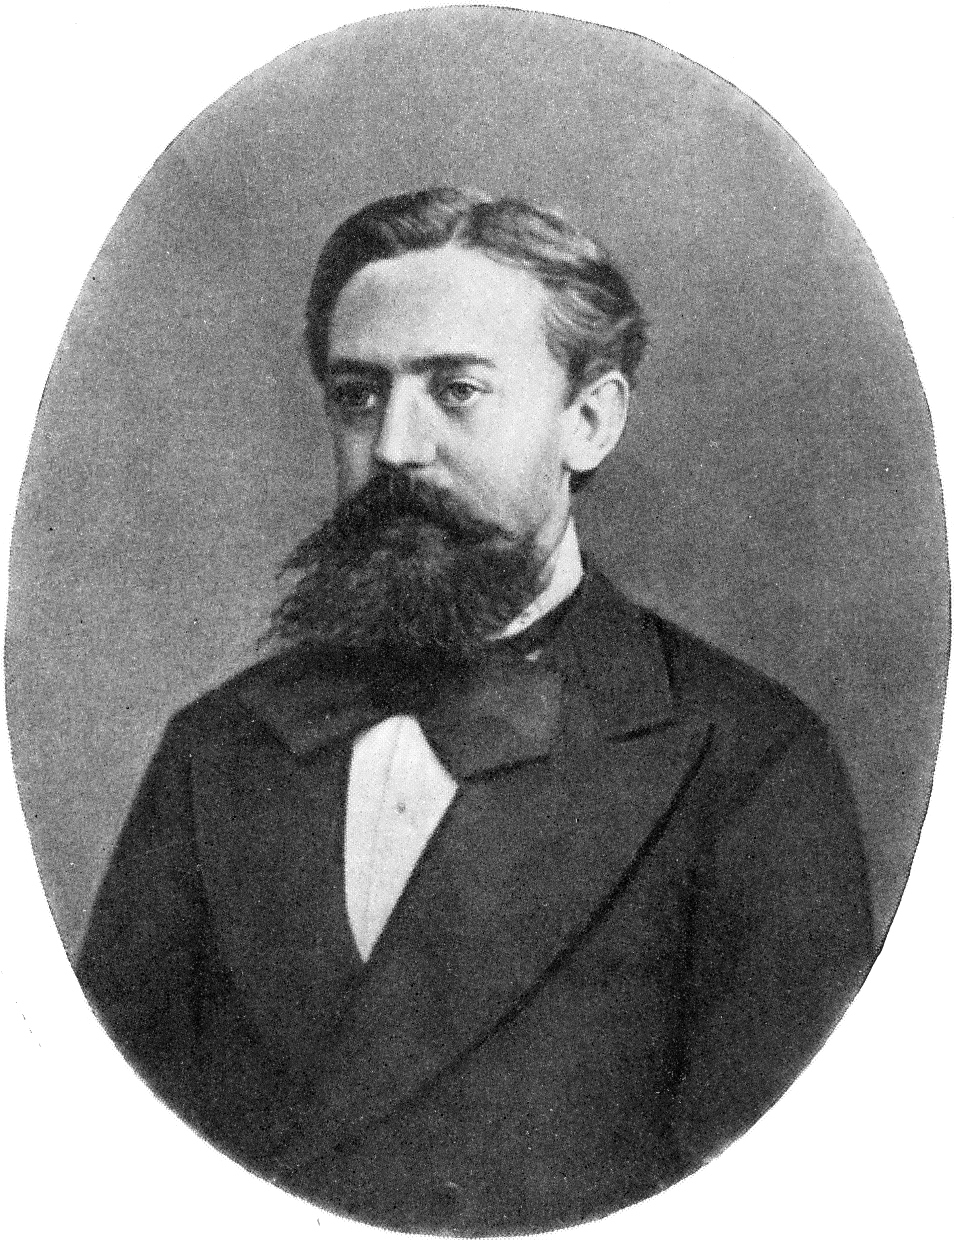
Russian mathematician Andrey Markov from Wikipedia.

A simple Markov model with two states. The probabilities on the outgoing arrows all add up to 1.
Andrey Markov had a great beard . He also gave his name to a way to describe the idea that some events follow other events more often than others.
Talking about Markov chains makes you sound clever and arcane. Fear not! There is an example that we are all really comfortable with: predictive text.

This is me banging away on my phone. For a laugh, post the resulting sentence from pressing the middle result on your phone to the comments.
In this animation I’m just pressing the suggested option as it comes up. If you try this on your phone you might get a different outcome because the phone learns your way of writing.
You could use any word next, but there is a far higher probability that am will follow I than shrimp.
This list of probabilities is what we want to find. There has already been some great work done by Autodesk research on this type of thing. They used a small cohort, and did it based on interviews. Their data isn’t all that great, but they are much more interested in the mathematics of the solution[1. Customizing The Behavior Of Interacting Occupants Using Personas: Rhys Goldstein, Alex Tessier, and Azam Khan This is pretty heavy duty, but worth a look if that’s what you’re into!].
By running our data through some magic algorithms we’ll be able to train Markov models based on reality. Even better we can train a suite of them to describe groups of people and see how they differ.
What can we use one for?
Once we have a way of describing what people do, in an abstract way, then we can use it to test our designs. We can even develop a number of personas so that we can more accurately capture the different types of people that inhabit a workplace.
This is all very well, but we need a way of describing what test actually means. I’ve been using opportunity for face to face interaction to describe things so far, so I’ll keep going.
Defining data-backed Personas
A persona is a way of describing some kind of abstract user of your system. Traditionally you’d do them by interviewing a lot of people and then working out a few general characters. You’d make some sort of classification that makes sense to you and then try to describe that person in a useful amount of detail.
This is a traditional persona; it’s pretty grim. There has been a lot of guessing to develop it.
Now that people log into websites and hand over lots of personal data, it’s possible to do segmentation based on more quantifiable factors. This is the norm in marketing and web design, but isn’t possible in architecture because we can’t collect enough data. We’re hoping to change that (slowly).
We can apply the same segmentation methods to the movement data that we gather. Armed with that we can make personas based on real behaviour rather than arbitrary things like gender or age.
An agent model of office space
The Markov model describes the probabilistic behaviour of an agent in our simulation.
We’d use one agent to represent each person in our simulation. Real people are pretty complicated but we don’t need to model everything about a person to get some insight, our model just needs to be good enough.
“All models are wrong but some are useful”

Get ready, then take your turn.
A nice simple simulation model is a turn based one. In a normal board game with turns everyone takes their turn one after another. In a turn based sim, everyone decides what they are going to do next turn, then does it together. In that way it’s like paper, scissors, stone.
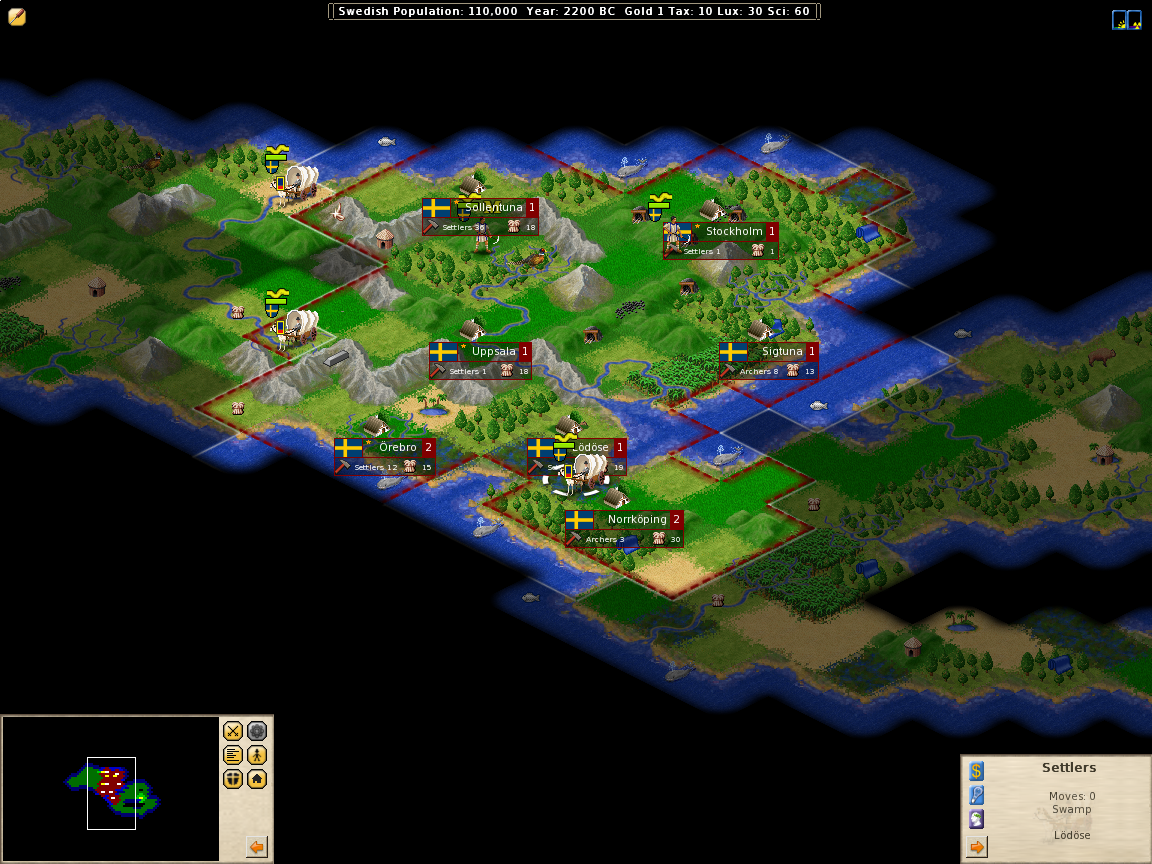
Civilisation, the classic turn based simulation game.
If you’ve ever played civilisation it’s exactly like that, except that none of the players are human. Because you don’t need to wait for the humans to take their turn it can run really fast.
At each turn there is a probability that each agent will change state. If we used a schedule based system then the entire office would charge over to the kitchen at exactly 11am to get a coffee. Then they’d all charge over to the toilet at 11:05am. We use a probabilistic model is to stop that happening. Even if we only use one persona we should still get a fairly natural movement pattern.
One of the visualisation styles from Towards Visualization of Simulated Occupants and their Interactions with Buildings at Multiple Time Scales by Simon Breslav, Rhys Goldstein, Alexander Tessier and Azam Khan from Autodesk research.
We can run this simulation really fast, so we can get a couple of hundred years of insight in a minute or two. Then we can build distributions of uses, e.g. 1σ[1. Sigma σ is one standard deviation. It’s a way of quantifying how far from the norm something is. 70% ish of things are less than one standard deviation away from the norm. 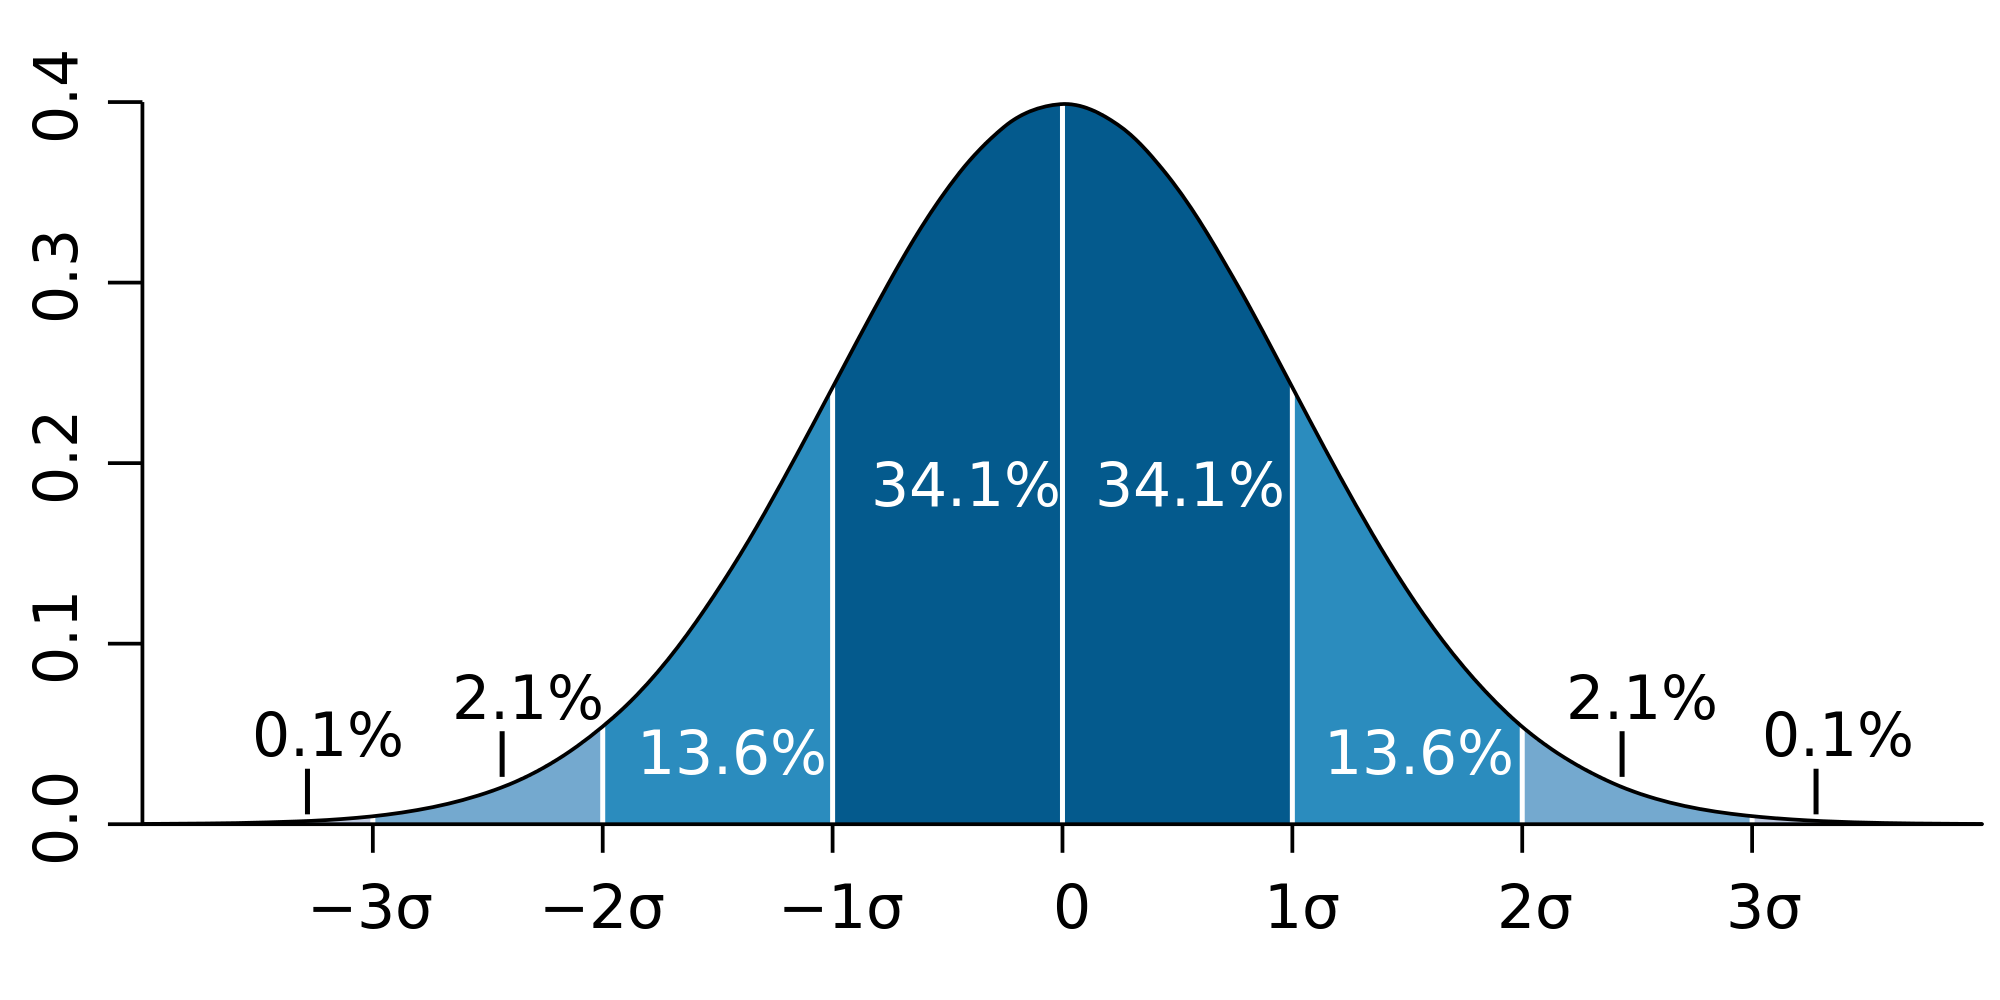 ] of the time there are no more than 4 people in the kitchen, but 5σ of the time there are less than 23 people. This kind of data is like having a Neufert’s guide specifically for your layout. It’s nice to have, but a bit dry.
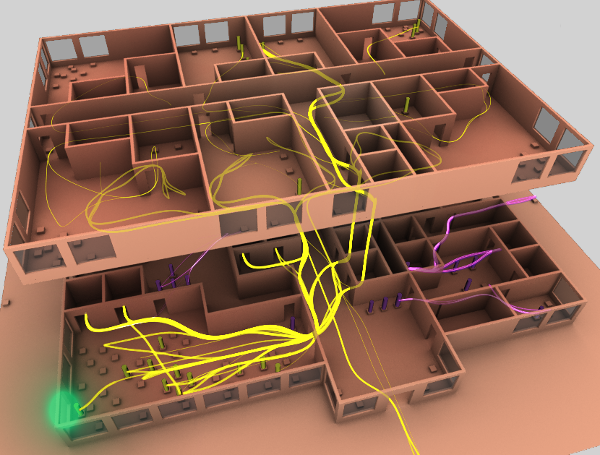
Imagine we are looking for opportunities for face to face interaction. We can search for times in the simulation that people are close to each other and facing each other. That’s an overly simplistic measure, it’s just an illustration that Tiara is going to expand on in her honours thesis. We can then drop a marker whenever we spot a potential interaction, then build up a heat map of the markers.
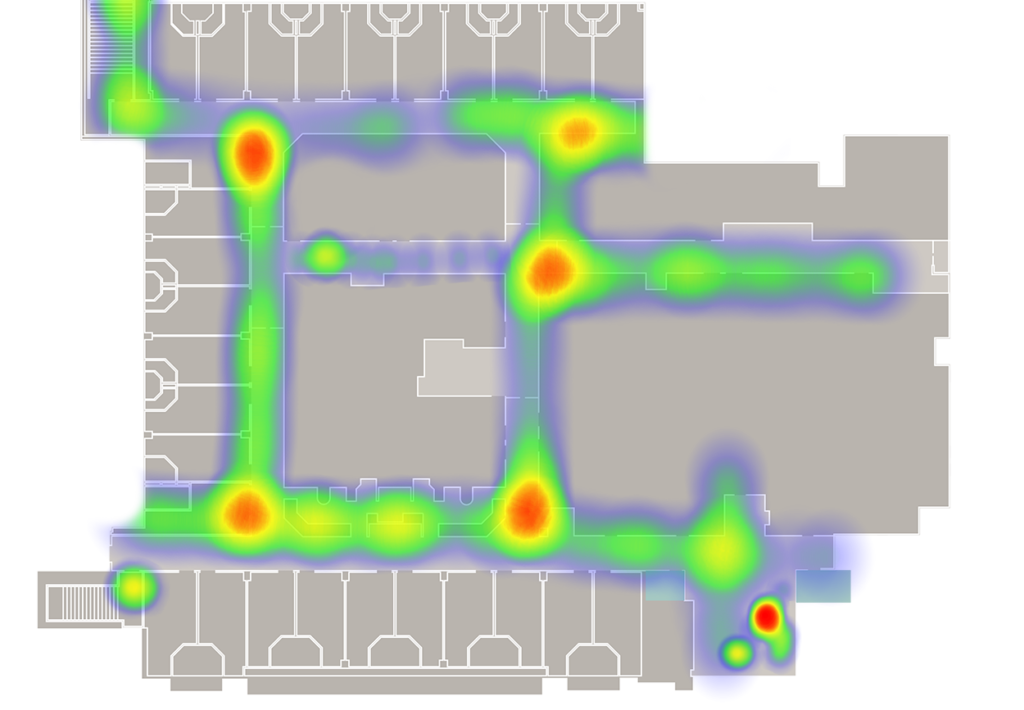
Heatmaps like this are nice, but they don’t tell you much more than the wear pattern on carpet. You can take time slices out of them, but you can’t tell where the people were coming from or going to. Annisa is going to write a post soon about her honours thesis on how to visualise people flow.
These kinds of heat map are nice images, but they get really powerful when we have a series of them that quantify several options of a design.
I’m sure you can think of a thousand more ways to use this, but hopefully you get the drift by now!
So why are there sensors in the toilets?
We want to model people movement in offices as a markov chain. If you think back to the states that a person can be in then someone will move between them at different probabilities[1. Also, in real life, these probabilities will change over the day (or even week). You can think of the probabilities at a single time as a matrix, like the matrix of distances in a road atlas. Your road atlas has distances, but imagine if it had the same matrix on each page of a book, but with travel times at different times of the day. A to B would take longer in the rush hour than at 3am. It’s the same with these probabilities; people are more likely to go to the kitchen at lunch time than at other times of day.].
Now we have probabilities on the edges of this graph it’s much more useful. We can start to gain insight into what this person is like. We can also use it to develop simulations.
This is one way of representing a markov chain model of how a random person[1. Really random, I generated it with this bit of code] moves through their day. If they are at their desk then there’s a good chance that they’ll go to meeting room south next. They only ever go to the toilet after going to the kitchen or the verandah, and (oddly) they usually visit someone else’s desk after they’ve been to the toilet. Here’s an example of the data:
Desk —7%→ Someone else’s desk
Desk —2%→ Meeting N
Desk —4%→ Meeting S
Desk —1%→ Quiet N
Desk —2%→ Quiet S
Desk —85%→ Desk (Stay put)
These numbers are just made up, but based on my intuitions about what people do. It’ll be interesting to see how wrong I am once we have real data.
Just as a reminder, this isn’t the data from one person, but rather the aggregate behaviour of a class of people, however we end up defining a class[1. In this case I just made it up, but a class might be females, or people under 30. See the ethics post about what you can and can’t do when defining a class.].
Knowing the likely order of this behaviour is important, and so it’s also important that we know all the places that abstract people go. There have been lots of examples of manipulating the location of the toilets in a building to maximise the opportunities for people to bump into each other. The most famous was when Steve Jobs was commissioning the Pixar building[1. How 30-minute toilet breaks improved the creativity at Pixar: “Steve Jobs realized that our environment affects our thoughts and behaviors. When he bought Pixar, he immediately started implementing changes to their office structure.¶ Jobs noted how all the experts were sitting in their own parts of Pixar’s headquarter. This made it nearly impossible for anyone to bump into or talk to someone who worked in a different field.¶ His solution was to put all the necessities (coffee machines, lunch room, toilets, water coolers) in the middle of the headquarter. This opened up for random conversations between people who rarely talked to each other before.”]. I know of at least one BVN building that has done this too (SE Water). Toilets aren’t a special case, there are lots of other important things in buildings—like meeting rooms or kitchens—but they are an important thing. If we don’t collect data about people’s trips there then our model won’t be able to account for an important driver in human movement.
To put your mind at rest, the base stations in the toilets can’t record anything other than a badge’s proximity to it. The data will also never be available for making decisions about individuals. That means that you can continue to take hour long toilet breaks, we won’t tell on you! (Someone might notice through more traditional means though.)
[TODO: photo of Fiona]
We’ve had some form of people tracking in place for quite a while now.